Israeli vs Jamaican Births to Unmarried Women
COMPARE
Israeli
Jamaican
Births to Unmarried Women
Births to Unmarried Women Comparison
Israelis
Jamaicans
28.6%
BIRTHS TO UNMARRIED WOMEN
98.4/ 100
METRIC RATING
76th/ 347
METRIC RANK
38.5%
BIRTHS TO UNMARRIED WOMEN
0.0/ 100
METRIC RATING
298th/ 347
METRIC RANK
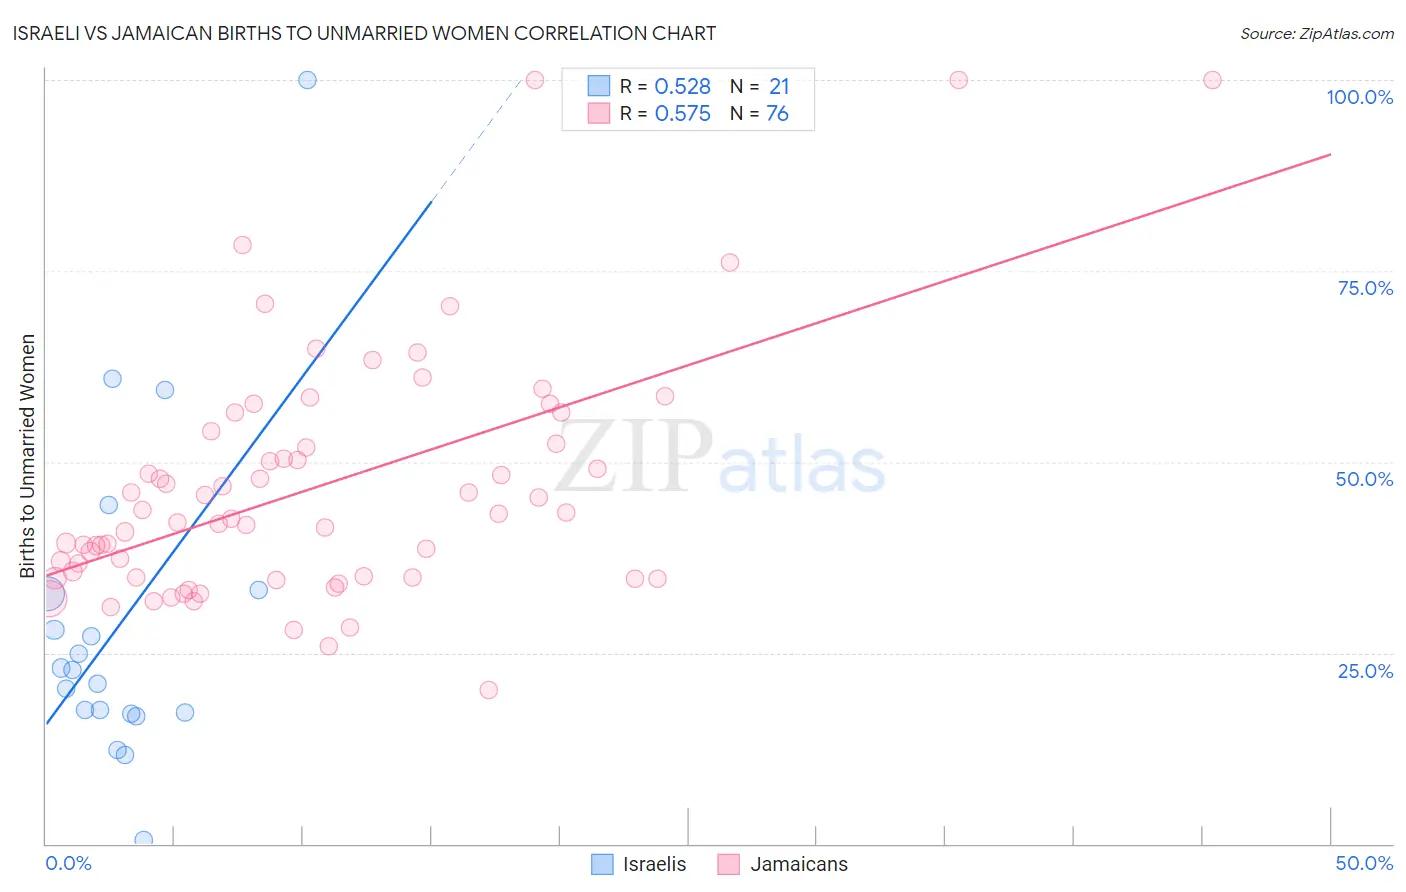
Israeli vs Jamaican Births to Unmarried Women Correlation Chart
The statistical analysis conducted on geographies consisting of 199,706,884 people shows a substantial positive correlation between the proportion of Israelis and percentage of births to unmarried women in the United States with a correlation coefficient (R) of 0.528 and weighted average of 28.6%. Similarly, the statistical analysis conducted on geographies consisting of 347,671,371 people shows a substantial positive correlation between the proportion of Jamaicans and percentage of births to unmarried women in the United States with a correlation coefficient (R) of 0.575 and weighted average of 38.5%, a difference of 34.6%.
Births to Unmarried Women Correlation Summary
| Measurement | Israeli | Jamaican |
| Minimum | 0.50% | 20.2% |
| Maximum | 100.0% | 100.0% |
| Range | 99.5% | 79.8% |
| Mean | 28.9% | 46.7% |
| Median | 22.7% | 42.9% |
| Interquartile 25% (IQ1) | 17.1% | 34.9% |
| Interquartile 75% (IQ3) | 33.0% | 53.2% |
| Interquartile Range (IQR) | 15.9% | 18.3% |
| Standard Deviation (Sample) | 21.9% | 16.1% |
| Standard Deviation (Population) | 21.4% | 16.0% |
Similar Demographics by Births to Unmarried Women
Demographics Similar to Israelis by Births to Unmarried Women
In terms of births to unmarried women, the demographic groups most similar to Israelis are Immigrants from Switzerland (28.6%, a difference of 0.020%), Immigrants from Bolivia (28.6%, a difference of 0.10%), Albanian (28.5%, a difference of 0.13%), Immigrants from Sweden (28.5%, a difference of 0.18%), and Immigrants from Northern Europe (28.6%, a difference of 0.19%).
| Demographics | Rating | Rank | Births to Unmarried Women |
| Bolivians | 98.7 /100 | #69 | Exceptional 28.5% |
| Laotians | 98.6 /100 | #70 | Exceptional 28.5% |
| Jordanians | 98.5 /100 | #71 | Exceptional 28.5% |
| Immigrants | Sweden | 98.5 /100 | #72 | Exceptional 28.5% |
| Albanians | 98.5 /100 | #73 | Exceptional 28.5% |
| Immigrants | Bolivia | 98.5 /100 | #74 | Exceptional 28.6% |
| Immigrants | Switzerland | 98.4 /100 | #75 | Exceptional 28.6% |
| Israelis | 98.4 /100 | #76 | Exceptional 28.6% |
| Immigrants | Northern Europe | 98.3 /100 | #77 | Exceptional 28.6% |
| Zimbabweans | 98.2 /100 | #78 | Exceptional 28.7% |
| Danes | 98.2 /100 | #79 | Exceptional 28.7% |
| Immigrants | Afghanistan | 98.1 /100 | #80 | Exceptional 28.7% |
| Immigrants | Austria | 98.1 /100 | #81 | Exceptional 28.7% |
| Romanians | 98.0 /100 | #82 | Exceptional 28.7% |
| Immigrants | Kuwait | 98.0 /100 | #83 | Exceptional 28.8% |
Demographics Similar to Jamaicans by Births to Unmarried Women
In terms of births to unmarried women, the demographic groups most similar to Jamaicans are Dutch West Indian (38.4%, a difference of 0.20%), Spanish American (38.6%, a difference of 0.20%), Immigrants from West Indies (38.6%, a difference of 0.26%), Haitian (38.6%, a difference of 0.27%), and Alaska Native (38.3%, a difference of 0.48%).
| Demographics | Rating | Rank | Births to Unmarried Women |
| Seminole | 0.0 /100 | #291 | Tragic 37.9% |
| Blackfeet | 0.0 /100 | #292 | Tragic 37.9% |
| Immigrants | Nicaragua | 0.0 /100 | #293 | Tragic 38.0% |
| British West Indians | 0.0 /100 | #294 | Tragic 38.0% |
| Iroquois | 0.0 /100 | #295 | Tragic 38.2% |
| Alaska Natives | 0.0 /100 | #296 | Tragic 38.3% |
| Dutch West Indians | 0.0 /100 | #297 | Tragic 38.4% |
| Jamaicans | 0.0 /100 | #298 | Tragic 38.5% |
| Spanish Americans | 0.0 /100 | #299 | Tragic 38.6% |
| Immigrants | West Indies | 0.0 /100 | #300 | Tragic 38.6% |
| Haitians | 0.0 /100 | #301 | Tragic 38.6% |
| Hondurans | 0.0 /100 | #302 | Tragic 38.7% |
| Immigrants | Jamaica | 0.0 /100 | #303 | Tragic 38.8% |
| Yaqui | 0.0 /100 | #304 | Tragic 38.8% |
| Immigrants | Haiti | 0.0 /100 | #305 | Tragic 38.9% |