Belizean vs Immigrants from Argentina Family Households
COMPARE
Belizean
Immigrants from Argentina
Family Households
Family Households Comparison
Belizeans
Immigrants from Argentina
64.8%
FAMILY HOUSEHOLDS
89.3/ 100
METRIC RATING
133rd/ 347
METRIC RANK
64.9%
FAMILY HOUSEHOLDS
92.8/ 100
METRIC RATING
124th/ 347
METRIC RANK
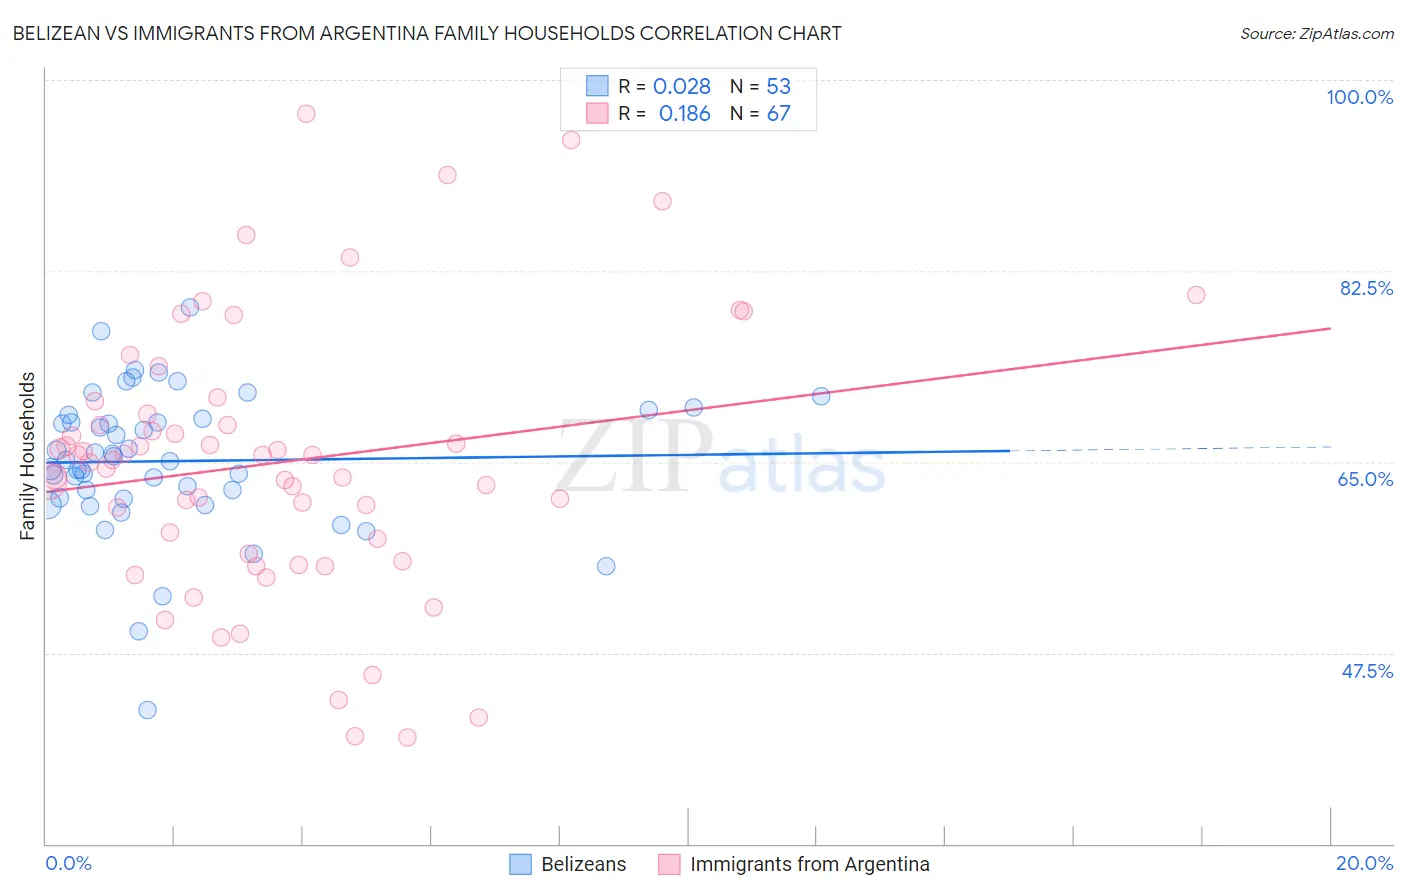
Belizean vs Immigrants from Argentina Family Households Correlation Chart
The statistical analysis conducted on geographies consisting of 144,151,479 people shows no correlation between the proportion of Belizeans and percentage of family households in the United States with a correlation coefficient (R) of 0.028 and weighted average of 64.8%. Similarly, the statistical analysis conducted on geographies consisting of 264,360,564 people shows a poor positive correlation between the proportion of Immigrants from Argentina and percentage of family households in the United States with a correlation coefficient (R) of 0.186 and weighted average of 64.9%, a difference of 0.15%.
Family Households Correlation Summary
| Measurement | Belizean | Immigrants from Argentina |
| Minimum | 42.3% | 39.7% |
| Maximum | 79.2% | 96.9% |
| Range | 36.9% | 57.2% |
| Mean | 65.1% | 64.9% |
| Median | 65.1% | 65.2% |
| Interquartile 25% (IQ1) | 61.6% | 56.6% |
| Interquartile 75% (IQ3) | 69.1% | 69.4% |
| Interquartile Range (IQR) | 7.5% | 12.8% |
| Standard Deviation (Sample) | 6.6% | 12.3% |
| Standard Deviation (Population) | 6.5% | 12.2% |
Demographics Similar to Belizeans and Immigrants from Argentina by Family Households
In terms of family households, the demographic groups most similar to Belizeans are Cajun (64.8%, a difference of 0.0%), Nonimmigrants (64.8%, a difference of 0.030%), Immigrants from Italy (64.8%, a difference of 0.040%), Greek (64.7%, a difference of 0.040%), and Maltese (64.7%, a difference of 0.060%). Similarly, the demographic groups most similar to Immigrants from Argentina are Immigrants from Belize (64.9%, a difference of 0.010%), Panamanian (64.8%, a difference of 0.020%), Hmong (64.9%, a difference of 0.030%), Choctaw (64.9%, a difference of 0.030%), and Immigrants from Panama (64.8%, a difference of 0.040%).
| Demographics | Rating | Rank | Family Households |
| Dutch | 95.1 /100 | #118 | Exceptional 64.9% |
| Immigrants | Eastern Asia | 94.4 /100 | #119 | Exceptional 64.9% |
| Immigrants | Oceania | 94.2 /100 | #120 | Exceptional 64.9% |
| Hungarians | 94.0 /100 | #121 | Exceptional 64.9% |
| Hmong | 93.4 /100 | #122 | Exceptional 64.9% |
| Choctaw | 93.4 /100 | #123 | Exceptional 64.9% |
| Immigrants | Argentina | 92.8 /100 | #124 | Exceptional 64.9% |
| Immigrants | Belize | 92.7 /100 | #125 | Exceptional 64.9% |
| Panamanians | 92.4 /100 | #126 | Exceptional 64.8% |
| Immigrants | Panama | 92.0 /100 | #127 | Exceptional 64.8% |
| Italians | 91.9 /100 | #128 | Exceptional 64.8% |
| Immigrants | Ecuador | 91.4 /100 | #129 | Exceptional 64.8% |
| Immigrants | Italy | 90.2 /100 | #130 | Exceptional 64.8% |
| Immigrants | Nonimmigrants | 90.1 /100 | #131 | Exceptional 64.8% |
| Cajuns | 89.4 /100 | #132 | Excellent 64.8% |
| Belizeans | 89.3 /100 | #133 | Excellent 64.8% |
| Greeks | 88.1 /100 | #134 | Excellent 64.7% |
| Maltese | 87.4 /100 | #135 | Excellent 64.7% |
| Immigrants | China | 86.6 /100 | #136 | Excellent 64.7% |
| Immigrants | Scotland | 86.4 /100 | #137 | Excellent 64.7% |
| Basques | 85.5 /100 | #138 | Excellent 64.7% |