Armenian vs Immigrants from Syria Average Family Size
COMPARE
Armenian
Immigrants from Syria
Average Family Size
Average Family Size Comparison
Armenians
Immigrants from Syria
3.25
AVERAGE FAMILY SIZE
78.2/ 100
METRIC RATING
145th/ 347
METRIC RANK
3.26
AVERAGE FAMILY SIZE
90.6/ 100
METRIC RATING
127th/ 347
METRIC RANK
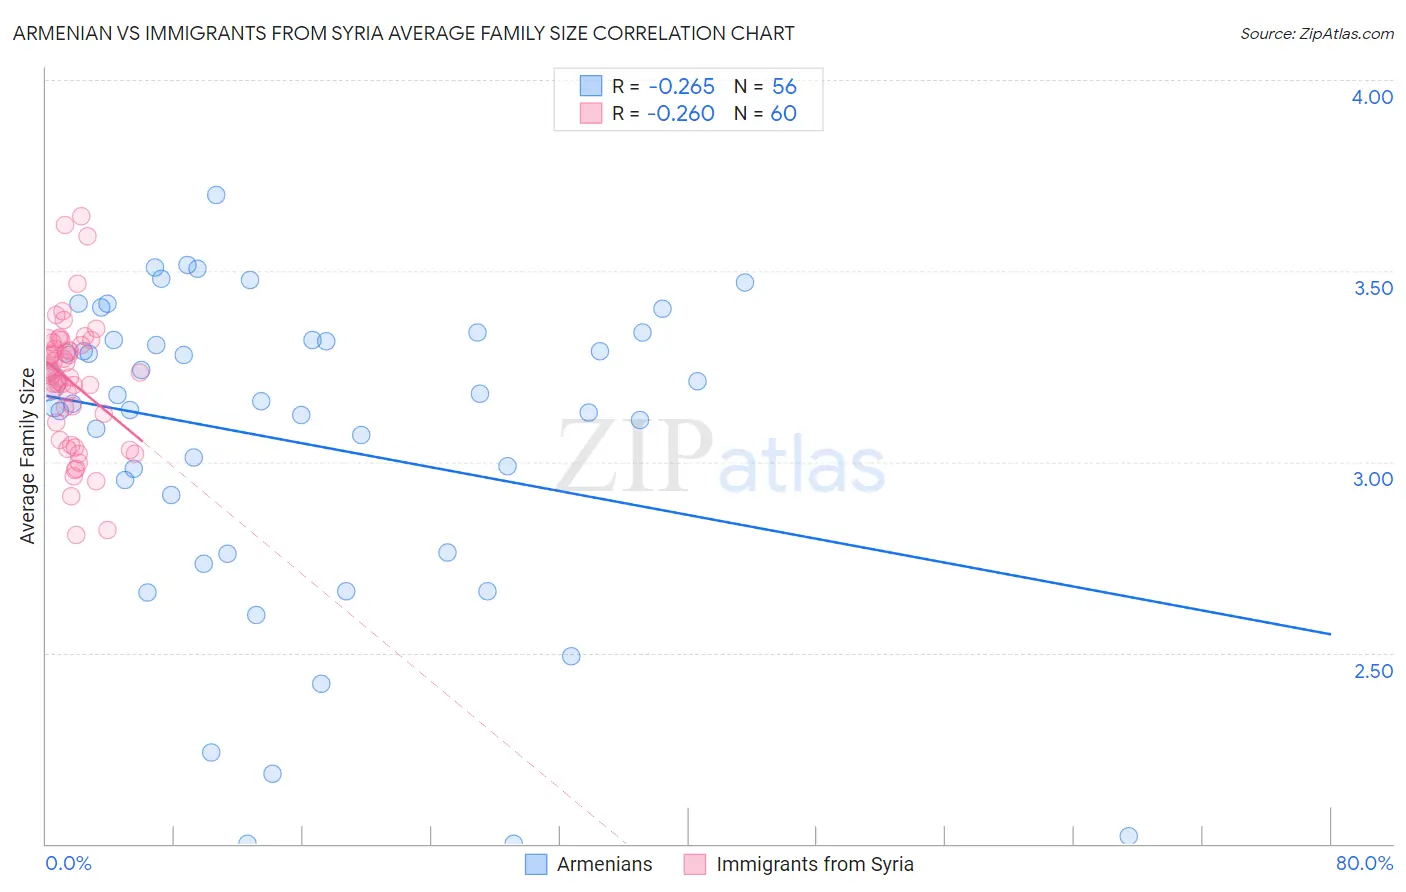
Armenian vs Immigrants from Syria Average Family Size Correlation Chart
The statistical analysis conducted on geographies consisting of 310,784,313 people shows a weak negative correlation between the proportion of Armenians and average family size in the United States with a correlation coefficient (R) of -0.265 and weighted average of 3.25. Similarly, the statistical analysis conducted on geographies consisting of 174,105,874 people shows a weak negative correlation between the proportion of Immigrants from Syria and average family size in the United States with a correlation coefficient (R) of -0.260 and weighted average of 3.26, a difference of 0.45%.
Average Family Size Correlation Summary
| Measurement | Armenian | Immigrants from Syria |
| Minimum | 2.00 | 2.81 |
| Maximum | 3.70 | 3.64 |
| Range | 1.70 | 0.83 |
| Mean | 3.05 | 3.21 |
| Median | 3.16 | 3.23 |
| Interquartile 25% (IQ1) | 2.84 | 3.08 |
| Interquartile 75% (IQ3) | 3.32 | 3.31 |
| Interquartile Range (IQR) | 0.48 | 0.23 |
| Standard Deviation (Sample) | 0.41 | 0.17 |
| Standard Deviation (Population) | 0.41 | 0.17 |
Demographics Similar to Armenians and Immigrants from Syria by Average Family Size
In terms of average family size, the demographic groups most similar to Armenians are Immigrants from Africa (3.25, a difference of 0.010%), Tsimshian (3.25, a difference of 0.050%), Bhutanese (3.25, a difference of 0.080%), Venezuelan (3.25, a difference of 0.090%), and Liberian (3.25, a difference of 0.090%). Similarly, the demographic groups most similar to Immigrants from Syria are Immigrants from Costa Rica (3.26, a difference of 0.010%), Colombian (3.26, a difference of 0.040%), Immigrants from Hong Kong (3.26, a difference of 0.10%), Laotian (3.26, a difference of 0.10%), and Immigrants from Western Asia (3.26, a difference of 0.13%).
| Demographics | Rating | Rank | Average Family Size |
| Immigrants | Costa Rica | 90.7 /100 | #126 | Exceptional 3.26 |
| Immigrants | Syria | 90.6 /100 | #127 | Exceptional 3.26 |
| Colombians | 89.9 /100 | #128 | Excellent 3.26 |
| Immigrants | Hong Kong | 88.6 /100 | #129 | Excellent 3.26 |
| Laotians | 88.5 /100 | #130 | Excellent 3.26 |
| Immigrants | Western Asia | 87.7 /100 | #131 | Excellent 3.26 |
| Costa Ricans | 86.8 /100 | #132 | Excellent 3.26 |
| Immigrants | Venezuela | 86.3 /100 | #133 | Excellent 3.26 |
| Africans | 84.9 /100 | #134 | Excellent 3.25 |
| Panamanians | 84.2 /100 | #135 | Excellent 3.25 |
| Comanche | 82.8 /100 | #136 | Excellent 3.25 |
| Immigrants | Middle Africa | 82.4 /100 | #137 | Excellent 3.25 |
| Cubans | 81.8 /100 | #138 | Excellent 3.25 |
| Immigrants | Ethiopia | 81.6 /100 | #139 | Excellent 3.25 |
| Sub-Saharan Africans | 81.6 /100 | #140 | Excellent 3.25 |
| Venezuelans | 81.4 /100 | #141 | Excellent 3.25 |
| Liberians | 81.2 /100 | #142 | Excellent 3.25 |
| Bhutanese | 81.0 /100 | #143 | Excellent 3.25 |
| Tsimshian | 80.2 /100 | #144 | Excellent 3.25 |
| Armenians | 78.2 /100 | #145 | Good 3.25 |
| Immigrants | Africa | 77.9 /100 | #146 | Good 3.25 |