Basque vs Aleut 10th Grade
COMPARE
Basque
Aleut
10th Grade
10th Grade Comparison
Basques
Aleuts
94.3%
10TH GRADE
94.9/ 100
METRIC RATING
124th/ 347
METRIC RANK
95.0%
10TH GRADE
99.8/ 100
METRIC RATING
58th/ 347
METRIC RANK
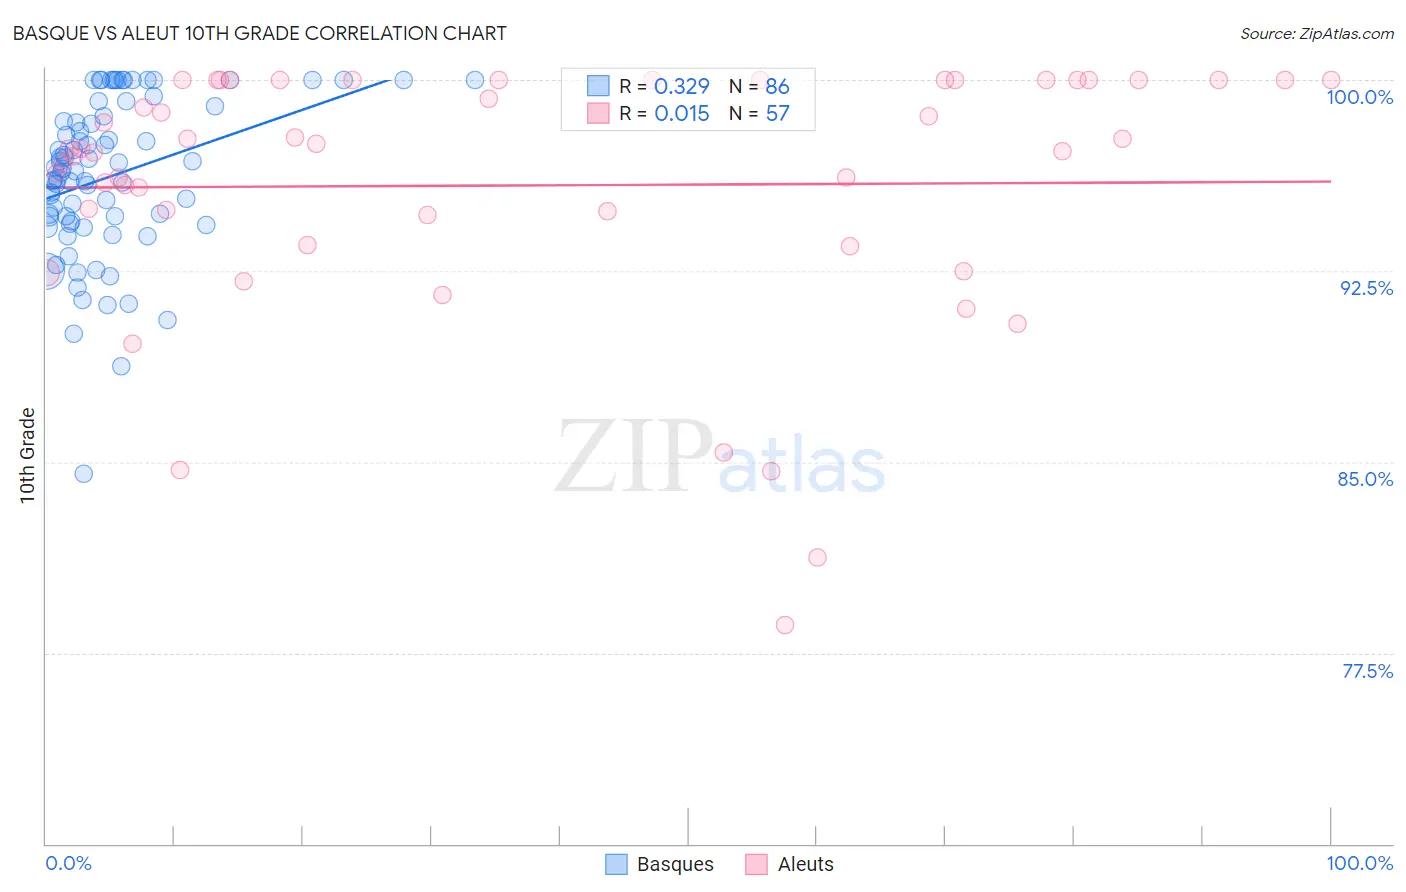
Basque vs Aleut 10th Grade Correlation Chart
The statistical analysis conducted on geographies consisting of 165,776,783 people shows a mild positive correlation between the proportion of Basques and percentage of population with at least 10th grade education in the United States with a correlation coefficient (R) of 0.329 and weighted average of 94.3%. Similarly, the statistical analysis conducted on geographies consisting of 61,782,736 people shows no correlation between the proportion of Aleuts and percentage of population with at least 10th grade education in the United States with a correlation coefficient (R) of 0.015 and weighted average of 95.0%, a difference of 0.71%.
10th Grade Correlation Summary
| Measurement | Basque | Aleut |
| Minimum | 84.6% | 78.6% |
| Maximum | 100.0% | 100.0% |
| Range | 15.4% | 21.4% |
| Mean | 96.2% | 95.9% |
| Median | 96.5% | 97.3% |
| Interquartile 25% (IQ1) | 94.5% | 94.1% |
| Interquartile 75% (IQ3) | 98.6% | 100.0% |
| Interquartile Range (IQR) | 4.1% | 5.9% |
| Standard Deviation (Sample) | 3.1% | 5.0% |
| Standard Deviation (Population) | 3.1% | 5.0% |
Similar Demographics by 10th Grade
Demographics Similar to Basques by 10th Grade
In terms of 10th grade, the demographic groups most similar to Basques are Immigrants from Belarus (94.4%, a difference of 0.010%), Inupiat (94.4%, a difference of 0.010%), Cree (94.4%, a difference of 0.010%), Immigrants from Taiwan (94.4%, a difference of 0.020%), and American (94.3%, a difference of 0.020%).
| Demographics | Rating | Rank | 10th Grade |
| Immigrants | Hungary | 95.8 /100 | #117 | Exceptional 94.4% |
| Jordanians | 95.6 /100 | #118 | Exceptional 94.4% |
| Immigrants | Israel | 95.4 /100 | #119 | Exceptional 94.4% |
| Immigrants | Taiwan | 95.3 /100 | #120 | Exceptional 94.4% |
| Immigrants | Belarus | 95.2 /100 | #121 | Exceptional 94.4% |
| Inupiat | 95.1 /100 | #122 | Exceptional 94.4% |
| Cree | 95.1 /100 | #123 | Exceptional 94.4% |
| Basques | 94.9 /100 | #124 | Exceptional 94.3% |
| Americans | 94.4 /100 | #125 | Exceptional 94.3% |
| Immigrants | Iran | 94.4 /100 | #126 | Exceptional 94.3% |
| Israelis | 93.8 /100 | #127 | Exceptional 94.3% |
| Potawatomi | 93.6 /100 | #128 | Exceptional 94.3% |
| Iroquois | 92.8 /100 | #129 | Exceptional 94.3% |
| Immigrants | Greece | 92.7 /100 | #130 | Exceptional 94.3% |
| Immigrants | Eastern Europe | 92.5 /100 | #131 | Exceptional 94.3% |
Demographics Similar to Aleuts by 10th Grade
In terms of 10th grade, the demographic groups most similar to Aleuts are Ukrainian (95.0%, a difference of 0.0%), Celtic (95.0%, a difference of 0.0%), Immigrants from Ireland (95.0%, a difference of 0.010%), New Zealander (95.0%, a difference of 0.010%), and Cypriot (95.0%, a difference of 0.010%).
| Demographics | Rating | Rank | 10th Grade |
| Austrians | 99.8 /100 | #51 | Exceptional 95.1% |
| Ottawa | 99.8 /100 | #52 | Exceptional 95.1% |
| Immigrants | North America | 99.8 /100 | #53 | Exceptional 95.0% |
| Immigrants | Lithuania | 99.8 /100 | #54 | Exceptional 95.0% |
| Immigrants | Ireland | 99.8 /100 | #55 | Exceptional 95.0% |
| New Zealanders | 99.8 /100 | #56 | Exceptional 95.0% |
| Ukrainians | 99.8 /100 | #57 | Exceptional 95.0% |
| Aleuts | 99.8 /100 | #58 | Exceptional 95.0% |
| Celtics | 99.8 /100 | #59 | Exceptional 95.0% |
| Cypriots | 99.8 /100 | #60 | Exceptional 95.0% |
| Chippewa | 99.8 /100 | #61 | Exceptional 95.0% |
| Thais | 99.8 /100 | #62 | Exceptional 95.0% |
| Immigrants | Singapore | 99.8 /100 | #63 | Exceptional 95.0% |
| Native Hawaiians | 99.7 /100 | #64 | Exceptional 95.0% |
| Turks | 99.7 /100 | #65 | Exceptional 95.0% |