Immigrants from Kazakhstan vs Asian Births to Unmarried Women
COMPARE
Immigrants from Kazakhstan
Asian
Births to Unmarried Women
Births to Unmarried Women Comparison
Immigrants from Kazakhstan
Asians
28.1%
BIRTHS TO UNMARRIED WOMEN
99.1/ 100
METRIC RATING
59th/ 347
METRIC RANK
26.8%
BIRTHS TO UNMARRIED WOMEN
99.9/ 100
METRIC RATING
26th/ 347
METRIC RANK
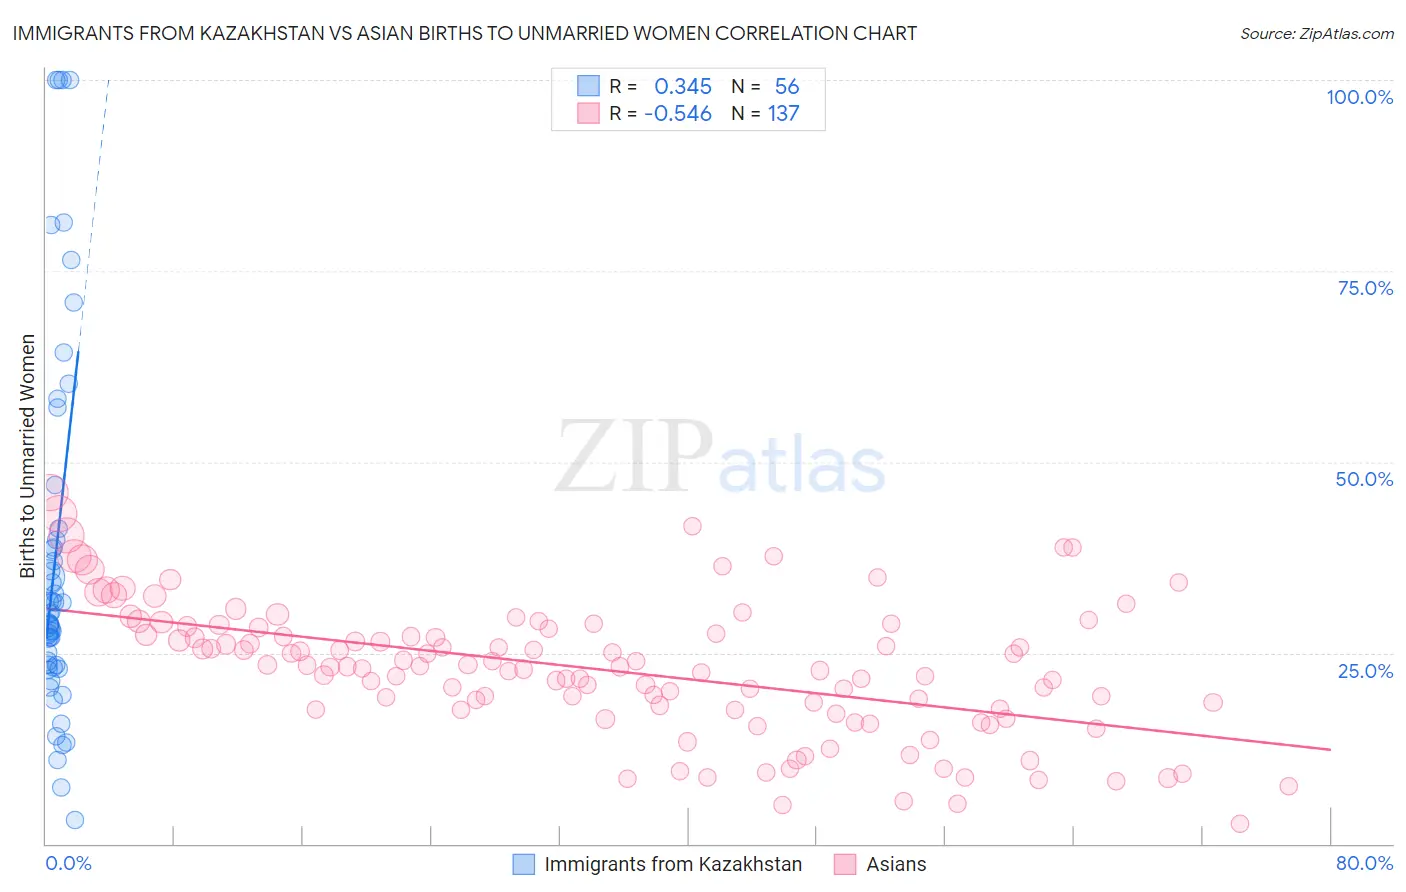
Immigrants from Kazakhstan vs Asian Births to Unmarried Women Correlation Chart
The statistical analysis conducted on geographies consisting of 120,028,218 people shows a mild positive correlation between the proportion of Immigrants from Kazakhstan and percentage of births to unmarried women in the United States with a correlation coefficient (R) of 0.345 and weighted average of 28.1%. Similarly, the statistical analysis conducted on geographies consisting of 495,064,366 people shows a substantial negative correlation between the proportion of Asians and percentage of births to unmarried women in the United States with a correlation coefficient (R) of -0.546 and weighted average of 26.8%, a difference of 5.0%.
Births to Unmarried Women Correlation Summary
| Measurement | Immigrants from Kazakhstan | Asian |
| Minimum | 3.1% | 2.7% |
| Maximum | 100.0% | 46.0% |
| Range | 96.9% | 43.3% |
| Mean | 37.8% | 22.8% |
| Median | 29.4% | 23.2% |
| Interquartile 25% (IQ1) | 23.2% | 17.5% |
| Interquartile 75% (IQ3) | 40.5% | 28.2% |
| Interquartile Range (IQR) | 17.2% | 10.7% |
| Standard Deviation (Sample) | 24.5% | 8.7% |
| Standard Deviation (Population) | 24.3% | 8.7% |
Similar Demographics by Births to Unmarried Women
Demographics Similar to Immigrants from Kazakhstan by Births to Unmarried Women
In terms of births to unmarried women, the demographic groups most similar to Immigrants from Kazakhstan are Immigrants from Turkey (28.1%, a difference of 0.040%), Immigrants from North Macedonia (28.1%, a difference of 0.090%), Immigrants from Albania (28.0%, a difference of 0.25%), Russian (28.0%, a difference of 0.36%), and Egyptian (28.2%, a difference of 0.41%).
| Demographics | Rating | Rank | Births to Unmarried Women |
| Bhutanese | 99.4 /100 | #52 | Exceptional 27.9% |
| Immigrants | Romania | 99.4 /100 | #53 | Exceptional 27.9% |
| Afghans | 99.4 /100 | #54 | Exceptional 27.9% |
| Mongolians | 99.3 /100 | #55 | Exceptional 27.9% |
| Immigrants | Belgium | 99.3 /100 | #56 | Exceptional 28.0% |
| Russians | 99.2 /100 | #57 | Exceptional 28.0% |
| Immigrants | Albania | 99.2 /100 | #58 | Exceptional 28.0% |
| Immigrants | Kazakhstan | 99.1 /100 | #59 | Exceptional 28.1% |
| Immigrants | Turkey | 99.1 /100 | #60 | Exceptional 28.1% |
| Immigrants | North Macedonia | 99.1 /100 | #61 | Exceptional 28.1% |
| Egyptians | 99.0 /100 | #62 | Exceptional 28.2% |
| Immigrants | Serbia | 98.9 /100 | #63 | Exceptional 28.3% |
| Tongans | 98.8 /100 | #64 | Exceptional 28.4% |
| Immigrants | Czechoslovakia | 98.8 /100 | #65 | Exceptional 28.4% |
| Immigrants | Egypt | 98.8 /100 | #66 | Exceptional 28.4% |
Demographics Similar to Asians by Births to Unmarried Women
In terms of births to unmarried women, the demographic groups most similar to Asians are Immigrants from Asia (26.8%, a difference of 0.010%), Cambodian (26.7%, a difference of 0.39%), Okinawan (26.9%, a difference of 0.52%), Immigrants from Australia (26.6%, a difference of 0.61%), and Cypriot (27.0%, a difference of 0.88%).
| Demographics | Rating | Rank | Births to Unmarried Women |
| Armenians | 99.9 /100 | #19 | Exceptional 26.2% |
| Immigrants | Korea | 99.9 /100 | #20 | Exceptional 26.3% |
| Soviet Union | 99.9 /100 | #21 | Exceptional 26.3% |
| Burmese | 99.9 /100 | #22 | Exceptional 26.4% |
| Immigrants | Japan | 99.9 /100 | #23 | Exceptional 26.4% |
| Immigrants | Australia | 99.9 /100 | #24 | Exceptional 26.6% |
| Cambodians | 99.9 /100 | #25 | Exceptional 26.7% |
| Asians | 99.9 /100 | #26 | Exceptional 26.8% |
| Immigrants | Asia | 99.9 /100 | #27 | Exceptional 26.8% |
| Okinawans | 99.8 /100 | #28 | Exceptional 26.9% |
| Cypriots | 99.8 /100 | #29 | Exceptional 27.0% |
| Bulgarians | 99.8 /100 | #30 | Exceptional 27.1% |
| Immigrants | Iraq | 99.8 /100 | #31 | Exceptional 27.1% |
| Immigrants | Russia | 99.8 /100 | #32 | Exceptional 27.1% |
| Immigrants | Sri Lanka | 99.8 /100 | #33 | Exceptional 27.2% |