Asian vs Finnish Married-couple Households
COMPARE
Asian
Finnish
Married-couple Households
Married-couple Households Comparison
Asians
Finns
49.5%
MARRIED-COUPLE HOUSEHOLDS
99.9/ 100
METRIC RATING
22nd/ 347
METRIC RANK
48.1%
MARRIED-COUPLE HOUSEHOLDS
98.0/ 100
METRIC RATING
81st/ 347
METRIC RANK
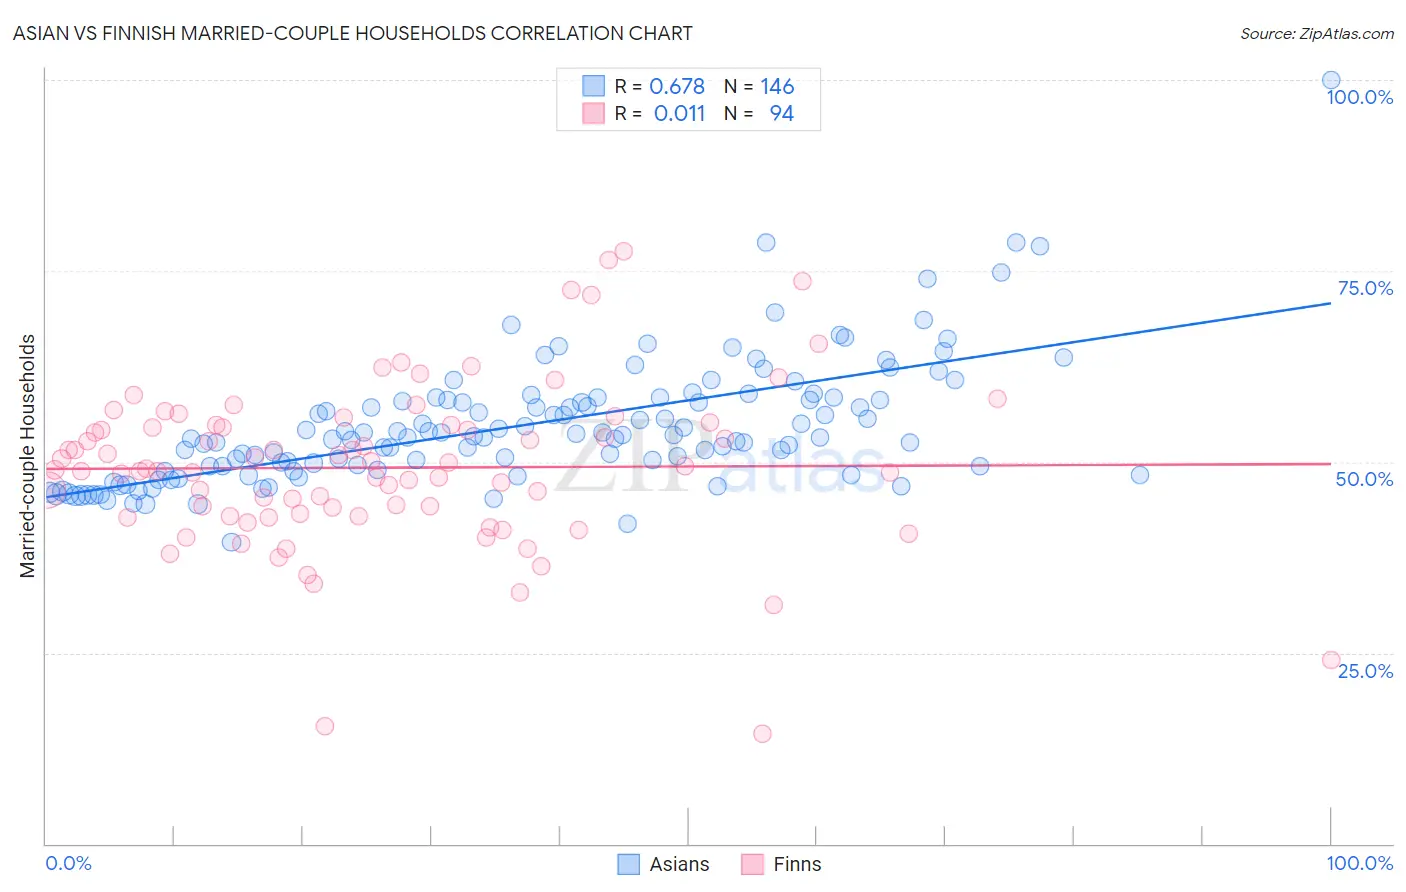
Asian vs Finnish Married-couple Households Correlation Chart
The statistical analysis conducted on geographies consisting of 550,235,479 people shows a significant positive correlation between the proportion of Asians and percentage of married-couple family households in the United States with a correlation coefficient (R) of 0.678 and weighted average of 49.5%. Similarly, the statistical analysis conducted on geographies consisting of 404,503,243 people shows no correlation between the proportion of Finns and percentage of married-couple family households in the United States with a correlation coefficient (R) of 0.011 and weighted average of 48.1%, a difference of 2.8%.
Married-couple Households Correlation Summary
| Measurement | Asian | Finnish |
| Minimum | 39.5% | 14.4% |
| Maximum | 100.0% | 77.6% |
| Range | 60.5% | 63.1% |
| Mean | 54.8% | 49.2% |
| Median | 53.3% | 49.0% |
| Interquartile 25% (IQ1) | 49.4% | 42.9% |
| Interquartile 75% (IQ3) | 58.2% | 54.8% |
| Interquartile Range (IQR) | 8.8% | 11.8% |
| Standard Deviation (Sample) | 8.3% | 10.8% |
| Standard Deviation (Population) | 8.3% | 10.8% |
Similar Demographics by Married-couple Households
Demographics Similar to Asians by Married-couple Households
In terms of married-couple households, the demographic groups most similar to Asians are Dutch (49.5%, a difference of 0.010%), Czech (49.4%, a difference of 0.090%), Norwegian (49.5%, a difference of 0.11%), European (49.6%, a difference of 0.17%), and Scandinavian (49.6%, a difference of 0.17%).
| Demographics | Rating | Rank | Married-couple Households |
| Koreans | 99.9 /100 | #15 | Exceptional 49.7% |
| Swedes | 99.9 /100 | #16 | Exceptional 49.7% |
| Immigrants | Hong Kong | 99.9 /100 | #17 | Exceptional 49.6% |
| English | 99.9 /100 | #18 | Exceptional 49.6% |
| Europeans | 99.9 /100 | #19 | Exceptional 49.6% |
| Scandinavians | 99.9 /100 | #20 | Exceptional 49.6% |
| Norwegians | 99.9 /100 | #21 | Exceptional 49.5% |
| Asians | 99.9 /100 | #22 | Exceptional 49.5% |
| Dutch | 99.9 /100 | #23 | Exceptional 49.5% |
| Czechs | 99.9 /100 | #24 | Exceptional 49.4% |
| Immigrants | Philippines | 99.9 /100 | #25 | Exceptional 49.3% |
| Immigrants | Scotland | 99.8 /100 | #26 | Exceptional 49.3% |
| Bhutanese | 99.8 /100 | #27 | Exceptional 49.3% |
| Germans | 99.8 /100 | #28 | Exceptional 49.2% |
| Maltese | 99.8 /100 | #29 | Exceptional 49.2% |
Demographics Similar to Finns by Married-couple Households
In terms of married-couple households, the demographic groups most similar to Finns are Russian (48.2%, a difference of 0.060%), Egyptian (48.2%, a difference of 0.090%), Immigrants from Netherlands (48.2%, a difference of 0.090%), Canadian (48.2%, a difference of 0.11%), and Immigrants from Poland (48.1%, a difference of 0.14%).
| Demographics | Rating | Rank | Married-couple Households |
| Immigrants | Romania | 98.6 /100 | #74 | Exceptional 48.3% |
| Immigrants | England | 98.4 /100 | #75 | Exceptional 48.2% |
| Immigrants | Fiji | 98.4 /100 | #76 | Exceptional 48.2% |
| Canadians | 98.2 /100 | #77 | Exceptional 48.2% |
| Egyptians | 98.2 /100 | #78 | Exceptional 48.2% |
| Immigrants | Netherlands | 98.2 /100 | #79 | Exceptional 48.2% |
| Russians | 98.1 /100 | #80 | Exceptional 48.2% |
| Finns | 98.0 /100 | #81 | Exceptional 48.1% |
| Immigrants | Poland | 97.7 /100 | #82 | Exceptional 48.1% |
| Guamanians/Chamorros | 97.6 /100 | #83 | Exceptional 48.1% |
| Ukrainians | 97.6 /100 | #84 | Exceptional 48.1% |
| Immigrants | Israel | 97.4 /100 | #85 | Exceptional 48.0% |
| Belgians | 97.4 /100 | #86 | Exceptional 48.0% |
| Immigrants | Ireland | 97.3 /100 | #87 | Exceptional 48.0% |
| Afghans | 97.3 /100 | #88 | Exceptional 48.0% |