Armenian vs Bahamian Unemployment Among Ages 25 to 29 years
COMPARE
Armenian
Bahamian
Unemployment Among Ages 25 to 29 years
Unemployment Among Ages 25 to 29 years Comparison
Armenians
Bahamians
7.7%
UNEMPLOYMENT AMONG AGES 25 TO 29 YEARS
0.0/ 100
METRIC RATING
290th/ 347
METRIC RANK
7.5%
UNEMPLOYMENT AMONG AGES 25 TO 29 YEARS
0.0/ 100
METRIC RATING
270th/ 347
METRIC RANK
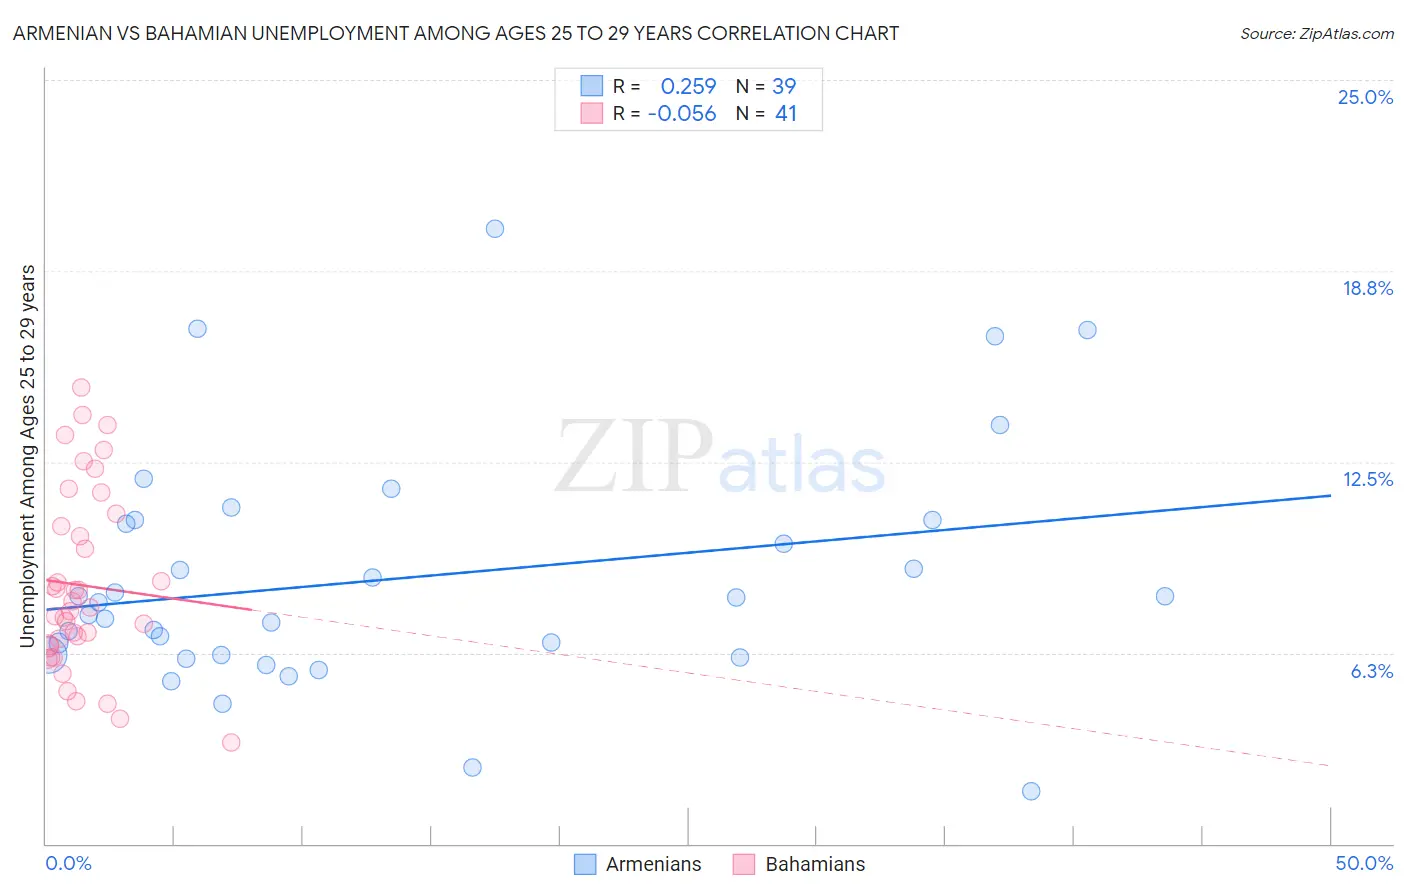
Armenian vs Bahamian Unemployment Among Ages 25 to 29 years Correlation Chart
The statistical analysis conducted on geographies consisting of 297,858,760 people shows a weak positive correlation between the proportion of Armenians and unemployment rate among population between the ages 25 and 29 in the United States with a correlation coefficient (R) of 0.259 and weighted average of 7.7%. Similarly, the statistical analysis conducted on geographies consisting of 110,749,635 people shows a slight negative correlation between the proportion of Bahamians and unemployment rate among population between the ages 25 and 29 in the United States with a correlation coefficient (R) of -0.056 and weighted average of 7.5%, a difference of 3.3%.
Unemployment Among Ages 25 to 29 years Correlation Summary
| Measurement | Armenian | Bahamian |
| Minimum | 1.7% | 3.3% |
| Maximum | 20.1% | 15.0% |
| Range | 18.4% | 11.7% |
| Mean | 8.7% | 8.5% |
| Median | 7.9% | 7.7% |
| Interquartile 25% (IQ1) | 6.2% | 6.5% |
| Interquartile 75% (IQ3) | 10.6% | 10.6% |
| Interquartile Range (IQR) | 4.4% | 4.1% |
| Standard Deviation (Sample) | 3.9% | 2.9% |
| Standard Deviation (Population) | 3.9% | 2.9% |
Demographics Similar to Armenians and Bahamians by Unemployment Among Ages 25 to 29 years
In terms of unemployment among ages 25 to 29 years, the demographic groups most similar to Armenians are Belizean (7.7%, a difference of 0.10%), African (7.6%, a difference of 0.81%), Immigrants from Mexico (7.6%, a difference of 0.87%), Vietnamese (7.6%, a difference of 1.5%), and Senegalese (7.6%, a difference of 1.5%). Similarly, the demographic groups most similar to Bahamians are Choctaw (7.5%, a difference of 0.020%), Immigrants from Bahamas (7.5%, a difference of 0.080%), Immigrants from Nigeria (7.5%, a difference of 0.10%), Immigrants from Central America (7.5%, a difference of 0.31%), and Immigrants from Ghana (7.5%, a difference of 0.39%).
| Demographics | Rating | Rank | Unemployment Among Ages 25 to 29 years |
| Bahamians | 0.0 /100 | #270 | Tragic 7.5% |
| Choctaw | 0.0 /100 | #271 | Tragic 7.5% |
| Immigrants | Bahamas | 0.0 /100 | #272 | Tragic 7.5% |
| Immigrants | Nigeria | 0.0 /100 | #273 | Tragic 7.5% |
| Immigrants | Central America | 0.0 /100 | #274 | Tragic 7.5% |
| Immigrants | Ghana | 0.0 /100 | #275 | Tragic 7.5% |
| French American Indians | 0.0 /100 | #276 | Tragic 7.5% |
| Iroquois | 0.0 /100 | #277 | Tragic 7.5% |
| Mexicans | 0.0 /100 | #278 | Tragic 7.5% |
| Nepalese | 0.0 /100 | #279 | Tragic 7.5% |
| Immigrants | Caribbean | 0.0 /100 | #280 | Tragic 7.5% |
| Immigrants | Bangladesh | 0.0 /100 | #281 | Tragic 7.5% |
| Immigrants | Senegal | 0.0 /100 | #282 | Tragic 7.6% |
| Creek | 0.0 /100 | #283 | Tragic 7.6% |
| Cherokee | 0.0 /100 | #284 | Tragic 7.6% |
| Senegalese | 0.0 /100 | #285 | Tragic 7.6% |
| Vietnamese | 0.0 /100 | #286 | Tragic 7.6% |
| Immigrants | Mexico | 0.0 /100 | #287 | Tragic 7.6% |
| Africans | 0.0 /100 | #288 | Tragic 7.6% |
| Belizeans | 0.0 /100 | #289 | Tragic 7.7% |
| Armenians | 0.0 /100 | #290 | Tragic 7.7% |