Immigrants from South Central Asia vs Immigrants from Venezuela Single Mother Households
COMPARE
Immigrants from South Central Asia
Immigrants from Venezuela
Single Mother Households
Single Mother Households Comparison
Immigrants from South Central Asia
Immigrants from Venezuela
5.4%
SINGLE MOTHER HOUSEHOLDS
99.5/ 100
METRIC RATING
43rd/ 347
METRIC RANK
6.7%
SINGLE MOTHER HOUSEHOLDS
8.5/ 100
METRIC RATING
211th/ 347
METRIC RANK
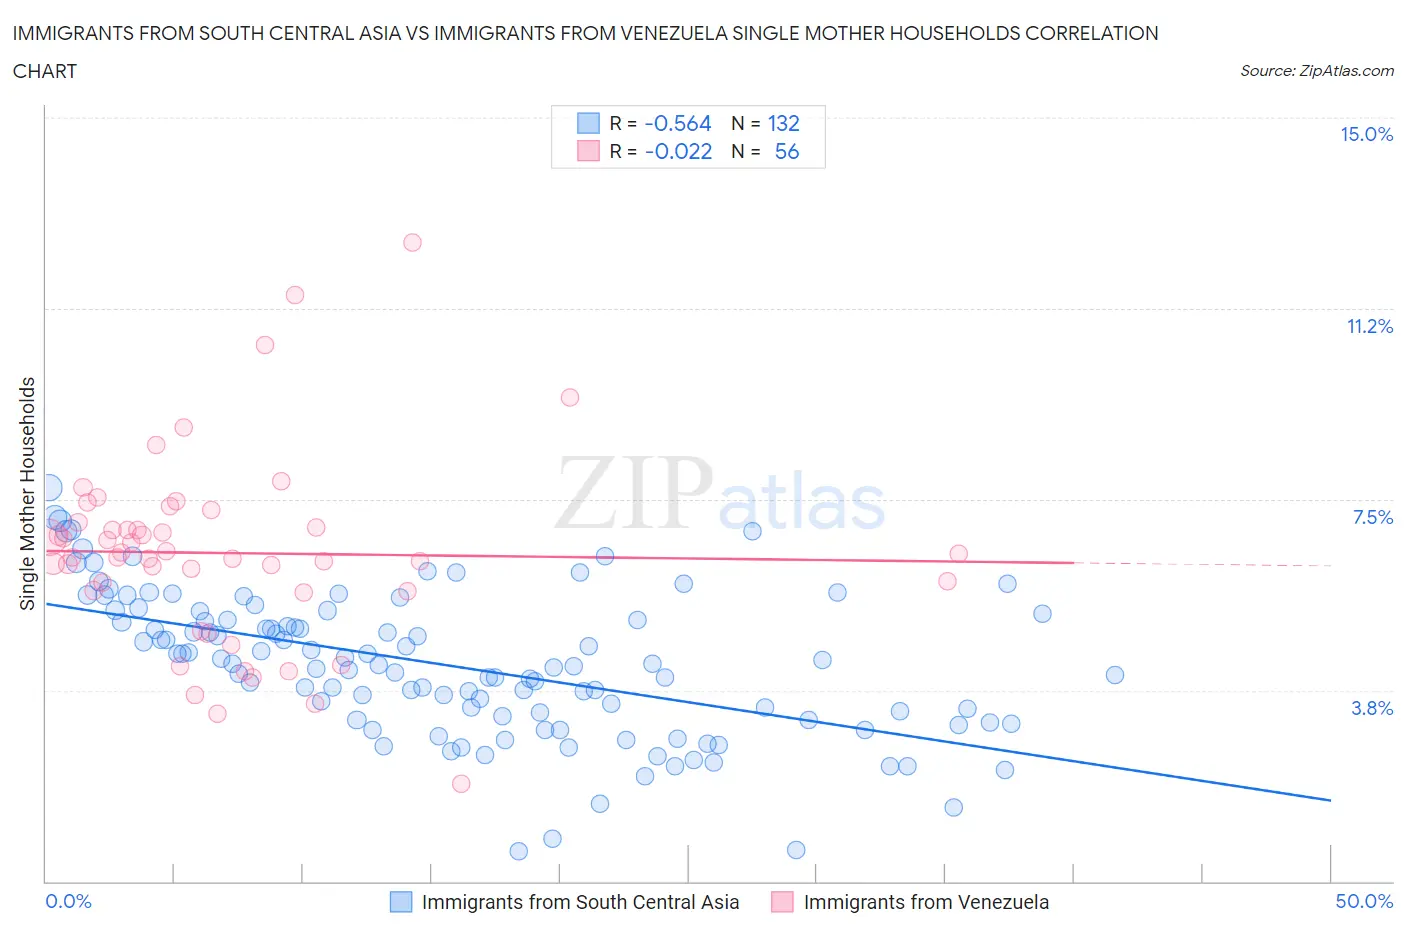
Immigrants from South Central Asia vs Immigrants from Venezuela Single Mother Households Correlation Chart
The statistical analysis conducted on geographies consisting of 471,288,107 people shows a substantial negative correlation between the proportion of Immigrants from South Central Asia and percentage of single mother households in the United States with a correlation coefficient (R) of -0.564 and weighted average of 5.4%. Similarly, the statistical analysis conducted on geographies consisting of 287,554,408 people shows no correlation between the proportion of Immigrants from Venezuela and percentage of single mother households in the United States with a correlation coefficient (R) of -0.022 and weighted average of 6.7%, a difference of 24.5%.
Single Mother Households Correlation Summary
| Measurement | Immigrants from South Central Asia | Immigrants from Venezuela |
| Minimum | 0.58% | 1.9% |
| Maximum | 7.7% | 12.6% |
| Range | 7.1% | 10.6% |
| Mean | 4.2% | 6.4% |
| Median | 4.3% | 6.4% |
| Interquartile 25% (IQ1) | 3.2% | 5.7% |
| Interquartile 75% (IQ3) | 5.2% | 7.0% |
| Interquartile Range (IQR) | 2.0% | 1.3% |
| Standard Deviation (Sample) | 1.4% | 1.9% |
| Standard Deviation (Population) | 1.4% | 1.9% |
Similar Demographics by Single Mother Households
Demographics Similar to Immigrants from South Central Asia by Single Mother Households
In terms of single mother households, the demographic groups most similar to Immigrants from South Central Asia are Macedonian (5.4%, a difference of 0.060%), Immigrants from Greece (5.4%, a difference of 0.14%), Estonian (5.4%, a difference of 0.56%), Immigrants from Sweden (5.4%, a difference of 0.67%), and Lithuanian (5.4%, a difference of 0.70%).
| Demographics | Rating | Rank | Single Mother Households |
| Immigrants | Czechoslovakia | 99.7 /100 | #36 | Exceptional 5.3% |
| Immigrants | Belgium | 99.7 /100 | #37 | Exceptional 5.3% |
| Immigrants | Serbia | 99.6 /100 | #38 | Exceptional 5.4% |
| Immigrants | Sweden | 99.6 /100 | #39 | Exceptional 5.4% |
| Estonians | 99.6 /100 | #40 | Exceptional 5.4% |
| Immigrants | Greece | 99.5 /100 | #41 | Exceptional 5.4% |
| Macedonians | 99.5 /100 | #42 | Exceptional 5.4% |
| Immigrants | South Central Asia | 99.5 /100 | #43 | Exceptional 5.4% |
| Lithuanians | 99.4 /100 | #44 | Exceptional 5.4% |
| Immigrants | Croatia | 99.4 /100 | #45 | Exceptional 5.4% |
| Croatians | 99.3 /100 | #46 | Exceptional 5.5% |
| Norwegians | 99.3 /100 | #47 | Exceptional 5.5% |
| Turks | 99.2 /100 | #48 | Exceptional 5.5% |
| Immigrants | Latvia | 99.2 /100 | #49 | Exceptional 5.5% |
| Immigrants | Scotland | 99.2 /100 | #50 | Exceptional 5.5% |
Demographics Similar to Immigrants from Venezuela by Single Mother Households
In terms of single mother households, the demographic groups most similar to Immigrants from Venezuela are Immigrants from Eritrea (6.7%, a difference of 0.050%), Immigrants from Costa Rica (6.7%, a difference of 0.11%), Immigrants from Uruguay (6.7%, a difference of 0.22%), Nonimmigrants (6.7%, a difference of 0.58%), and Immigrants from Colombia (6.7%, a difference of 0.60%).
| Demographics | Rating | Rank | Single Mother Households |
| Immigrants | Fiji | 11.9 /100 | #204 | Poor 6.7% |
| Cree | 11.9 /100 | #205 | Poor 6.7% |
| German Russians | 11.5 /100 | #206 | Poor 6.7% |
| Immigrants | South America | 11.5 /100 | #207 | Poor 6.7% |
| Vietnamese | 11.3 /100 | #208 | Poor 6.7% |
| Immigrants | Colombia | 10.5 /100 | #209 | Poor 6.7% |
| Immigrants | Nonimmigrants | 10.4 /100 | #210 | Poor 6.7% |
| Immigrants | Venezuela | 8.5 /100 | #211 | Tragic 6.7% |
| Immigrants | Eritrea | 8.4 /100 | #212 | Tragic 6.7% |
| Immigrants | Costa Rica | 8.2 /100 | #213 | Tragic 6.7% |
| Immigrants | Uruguay | 7.9 /100 | #214 | Tragic 6.7% |
| Shoshone | 5.7 /100 | #215 | Tragic 6.8% |
| Cherokee | 5.1 /100 | #216 | Tragic 6.8% |
| Aleuts | 4.8 /100 | #217 | Tragic 6.8% |
| Immigrants | Eastern Africa | 4.4 /100 | #218 | Tragic 6.8% |