Chippewa vs Puerto Rican Currently Married
COMPARE
Chippewa
Puerto Rican
Currently Married
Currently Married Comparison
Chippewa
Puerto Ricans
43.2%
CURRENTLY MARRIED
0.0/ 100
METRIC RATING
281st/ 347
METRIC RANK
39.9%
CURRENTLY MARRIED
0.0/ 100
METRIC RATING
334th/ 347
METRIC RANK
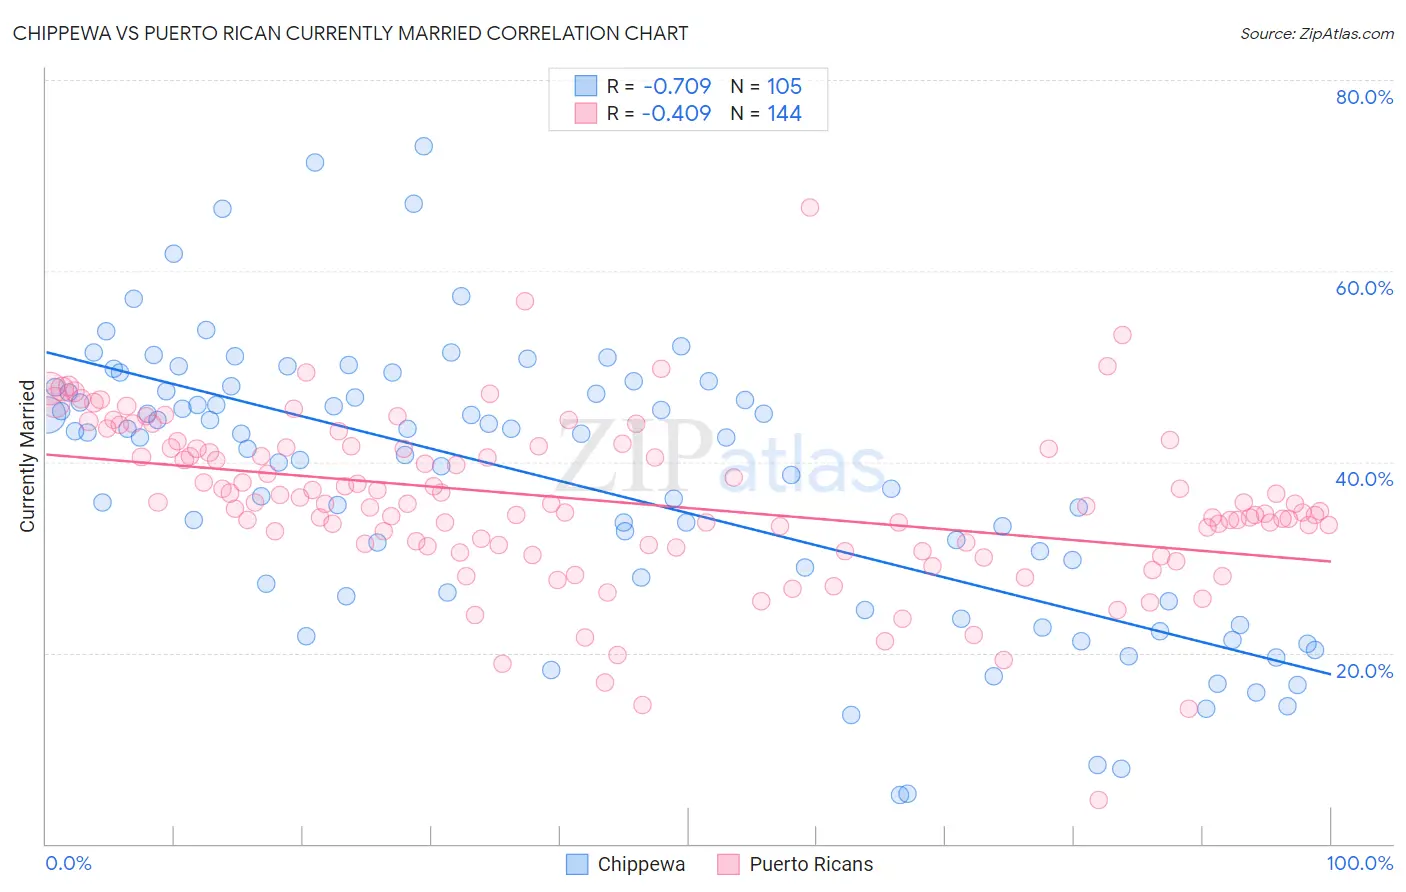
Chippewa vs Puerto Rican Currently Married Correlation Chart
The statistical analysis conducted on geographies consisting of 215,057,083 people shows a strong negative correlation between the proportion of Chippewa and percentage of population currently married in the United States with a correlation coefficient (R) of -0.709 and weighted average of 43.2%. Similarly, the statistical analysis conducted on geographies consisting of 528,221,069 people shows a moderate negative correlation between the proportion of Puerto Ricans and percentage of population currently married in the United States with a correlation coefficient (R) of -0.409 and weighted average of 39.9%, a difference of 8.4%.
Currently Married Correlation Summary
| Measurement | Chippewa | Puerto Rican |
| Minimum | 5.1% | 4.6% |
| Maximum | 73.1% | 66.7% |
| Range | 68.0% | 62.1% |
| Mean | 38.0% | 35.8% |
| Median | 42.5% | 35.4% |
| Interquartile 25% (IQ1) | 26.1% | 31.3% |
| Interquartile 75% (IQ3) | 47.6% | 41.4% |
| Interquartile Range (IQR) | 21.5% | 10.1% |
| Standard Deviation (Sample) | 14.5% | 8.6% |
| Standard Deviation (Population) | 14.4% | 8.6% |
Similar Demographics by Currently Married
Demographics Similar to Chippewa by Currently Married
In terms of currently married, the demographic groups most similar to Chippewa are Apache (43.2%, a difference of 0.010%), Immigrants from Ecuador (43.2%, a difference of 0.070%), Central American Indian (43.3%, a difference of 0.080%), Kiowa (43.2%, a difference of 0.19%), and Immigrants from El Salvador (43.1%, a difference of 0.20%).
| Demographics | Rating | Rank | Currently Married |
| Nigerians | 0.1 /100 | #274 | Tragic 43.4% |
| Colville | 0.1 /100 | #275 | Tragic 43.4% |
| Sierra Leoneans | 0.1 /100 | #276 | Tragic 43.4% |
| Immigrants | Nigeria | 0.1 /100 | #277 | Tragic 43.4% |
| Central Americans | 0.0 /100 | #278 | Tragic 43.3% |
| Central American Indians | 0.0 /100 | #279 | Tragic 43.3% |
| Apache | 0.0 /100 | #280 | Tragic 43.2% |
| Chippewa | 0.0 /100 | #281 | Tragic 43.2% |
| Immigrants | Ecuador | 0.0 /100 | #282 | Tragic 43.2% |
| Kiowa | 0.0 /100 | #283 | Tragic 43.2% |
| Immigrants | El Salvador | 0.0 /100 | #284 | Tragic 43.1% |
| Immigrants | Middle Africa | 0.0 /100 | #285 | Tragic 43.0% |
| Ghanaians | 0.0 /100 | #286 | Tragic 42.9% |
| Guatemalans | 0.0 /100 | #287 | Tragic 42.9% |
| Natives/Alaskans | 0.0 /100 | #288 | Tragic 42.8% |
Demographics Similar to Puerto Ricans by Currently Married
In terms of currently married, the demographic groups most similar to Puerto Ricans are Yup'ik (39.9%, a difference of 0.010%), Lumbee (39.8%, a difference of 0.16%), British West Indian (39.8%, a difference of 0.34%), Immigrants from St. Vincent and the Grenadines (40.1%, a difference of 0.41%), and Black/African American (39.6%, a difference of 0.72%).
| Demographics | Rating | Rank | Currently Married |
| Senegalese | 0.0 /100 | #327 | Tragic 40.6% |
| Arapaho | 0.0 /100 | #328 | Tragic 40.5% |
| Crow | 0.0 /100 | #329 | Tragic 40.4% |
| Immigrants | Dominica | 0.0 /100 | #330 | Tragic 40.3% |
| Immigrants | Barbados | 0.0 /100 | #331 | Tragic 40.3% |
| Immigrants | St. Vincent and the Grenadines | 0.0 /100 | #332 | Tragic 40.1% |
| Yup'ik | 0.0 /100 | #333 | Tragic 39.9% |
| Puerto Ricans | 0.0 /100 | #334 | Tragic 39.9% |
| Lumbee | 0.0 /100 | #335 | Tragic 39.8% |
| British West Indians | 0.0 /100 | #336 | Tragic 39.8% |
| Blacks/African Americans | 0.0 /100 | #337 | Tragic 39.6% |
| Cape Verdeans | 0.0 /100 | #338 | Tragic 39.6% |
| Dominicans | 0.0 /100 | #339 | Tragic 39.5% |
| Immigrants | Grenada | 0.0 /100 | #340 | Tragic 39.1% |
| Navajo | 0.0 /100 | #341 | Tragic 39.0% |