Alsatian vs Immigrants from Malaysia Family Households with Children
COMPARE
Alsatian
Immigrants from Malaysia
Family Households with Children
Family Households with Children Comparison
Alsatians
Immigrants from Malaysia
25.3%
FAMILY HOUSEHOLDS WITH CHILDREN
0.0/ 100
METRIC RATING
342nd/ 347
METRIC RANK
27.9%
FAMILY HOUSEHOLDS WITH CHILDREN
95.9/ 100
METRIC RATING
117th/ 347
METRIC RANK
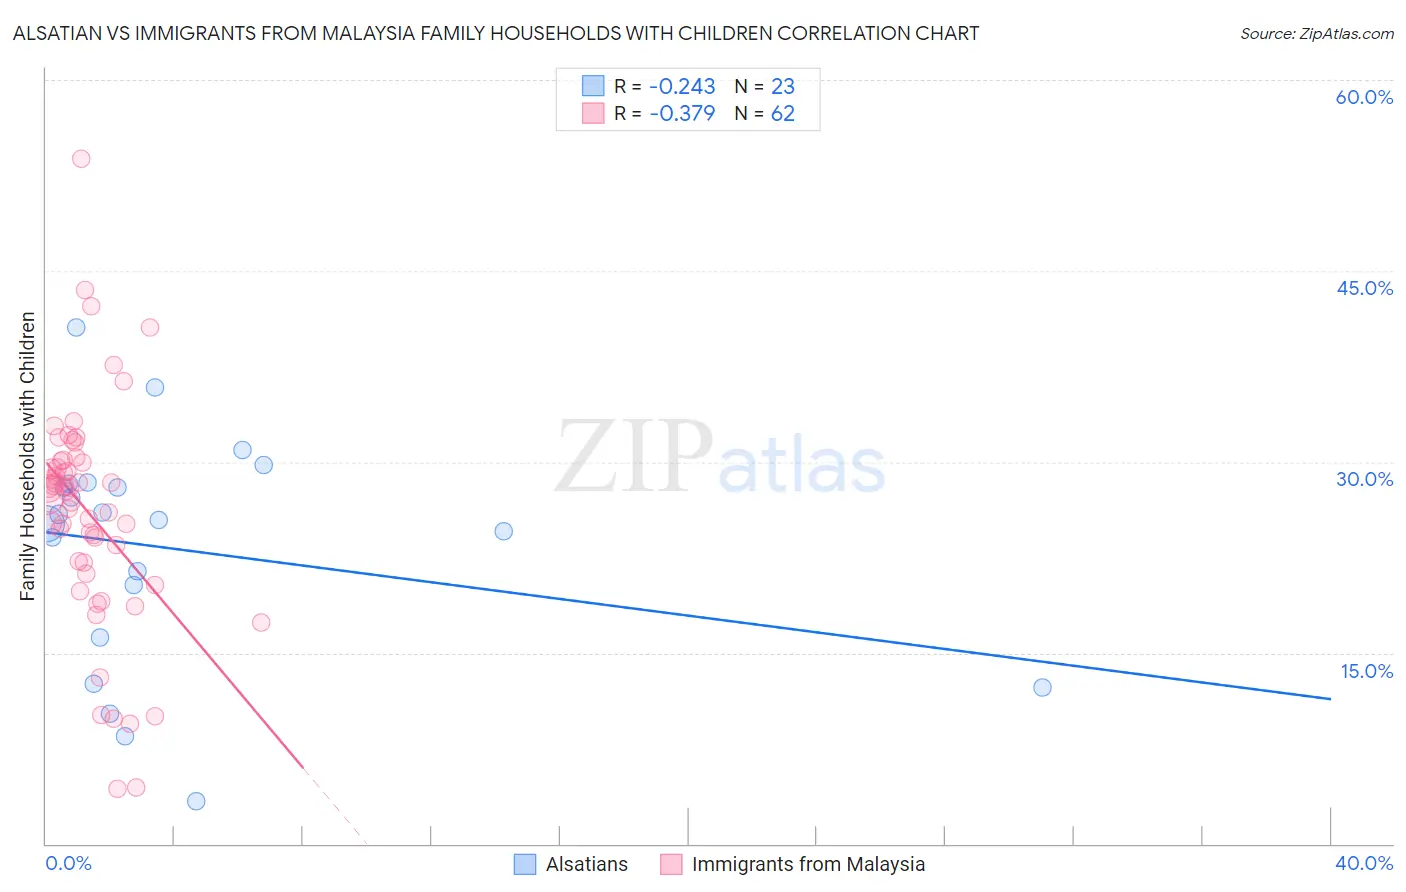
Alsatian vs Immigrants from Malaysia Family Households with Children Correlation Chart
The statistical analysis conducted on geographies consisting of 82,641,288 people shows a weak negative correlation between the proportion of Alsatians and percentage of family households with children in the United States with a correlation coefficient (R) of -0.243 and weighted average of 25.3%. Similarly, the statistical analysis conducted on geographies consisting of 197,900,652 people shows a mild negative correlation between the proportion of Immigrants from Malaysia and percentage of family households with children in the United States with a correlation coefficient (R) of -0.379 and weighted average of 27.9%, a difference of 10.4%.
Family Households with Children Correlation Summary
| Measurement | Alsatian | Immigrants from Malaysia |
| Minimum | 3.4% | 4.3% |
| Maximum | 40.5% | 53.8% |
| Range | 37.1% | 49.5% |
| Mean | 23.2% | 26.1% |
| Median | 25.4% | 27.8% |
| Interquartile 25% (IQ1) | 16.2% | 22.1% |
| Interquartile 75% (IQ3) | 28.3% | 30.1% |
| Interquartile Range (IQR) | 12.1% | 8.0% |
| Standard Deviation (Sample) | 9.0% | 8.9% |
| Standard Deviation (Population) | 8.8% | 8.8% |
Similar Demographics by Family Households with Children
Demographics Similar to Alsatians by Family Households with Children
In terms of family households with children, the demographic groups most similar to Alsatians are Hopi (25.2%, a difference of 0.16%), Pueblo (25.2%, a difference of 0.26%), Immigrants from Grenada (25.2%, a difference of 0.44%), Carpatho Rusyn (25.2%, a difference of 0.44%), and Immigrants from Serbia (25.5%, a difference of 0.68%).
| Demographics | Rating | Rank | Family Households with Children |
| Immigrants | Switzerland | 0.0 /100 | #333 | Tragic 25.7% |
| Slovaks | 0.0 /100 | #334 | Tragic 25.7% |
| Immigrants | Croatia | 0.0 /100 | #335 | Tragic 25.7% |
| Immigrants | West Indies | 0.0 /100 | #336 | Tragic 25.7% |
| Puerto Ricans | 0.0 /100 | #337 | Tragic 25.6% |
| Arapaho | 0.0 /100 | #338 | Tragic 25.6% |
| Immigrants | St. Vincent and the Grenadines | 0.0 /100 | #339 | Tragic 25.6% |
| Immigrants | Armenia | 0.0 /100 | #340 | Tragic 25.6% |
| Immigrants | Serbia | 0.0 /100 | #341 | Tragic 25.5% |
| Alsatians | 0.0 /100 | #342 | Tragic 25.3% |
| Hopi | 0.0 /100 | #343 | Tragic 25.2% |
| Pueblo | 0.0 /100 | #344 | Tragic 25.2% |
| Immigrants | Grenada | 0.0 /100 | #345 | Tragic 25.2% |
| Carpatho Rusyns | 0.0 /100 | #346 | Tragic 25.2% |
| Soviet Union | 0.0 /100 | #347 | Tragic 24.8% |
Demographics Similar to Immigrants from Malaysia by Family Households with Children
In terms of family households with children, the demographic groups most similar to Immigrants from Malaysia are Central American Indian (27.9%, a difference of 0.0%), Pakistani (27.9%, a difference of 0.010%), Zimbabwean (27.9%, a difference of 0.040%), European (27.9%, a difference of 0.070%), and South American Indian (28.0%, a difference of 0.14%).
| Demographics | Rating | Rank | Family Households with Children |
| Spaniards | 97.4 /100 | #110 | Exceptional 28.0% |
| Scandinavians | 97.1 /100 | #111 | Exceptional 28.0% |
| Immigrants | Middle Africa | 97.0 /100 | #112 | Exceptional 28.0% |
| Arabs | 97.0 /100 | #113 | Exceptional 28.0% |
| South American Indians | 96.9 /100 | #114 | Exceptional 28.0% |
| Immigrants | Africa | 96.8 /100 | #115 | Exceptional 28.0% |
| Pakistanis | 96.0 /100 | #116 | Exceptional 27.9% |
| Immigrants | Malaysia | 95.9 /100 | #117 | Exceptional 27.9% |
| Central American Indians | 95.9 /100 | #118 | Exceptional 27.9% |
| Zimbabweans | 95.6 /100 | #119 | Exceptional 27.9% |
| Europeans | 95.4 /100 | #120 | Exceptional 27.9% |
| Immigrants | Western Asia | 93.6 /100 | #121 | Exceptional 27.9% |
| Immigrants | Zimbabwe | 92.8 /100 | #122 | Exceptional 27.8% |
| Immigrants | Northern Africa | 91.8 /100 | #123 | Exceptional 27.8% |
| Immigrants | Singapore | 90.8 /100 | #124 | Exceptional 27.8% |