Okinawan vs Immigrants from Nicaragua Family Households
COMPARE
Okinawan
Immigrants from Nicaragua
Family Households
Family Households Comparison
Okinawans
Immigrants from Nicaragua
62.5%
FAMILY HOUSEHOLDS
0.0/ 100
METRIC RATING
295th/ 347
METRIC RANK
67.5%
FAMILY HOUSEHOLDS
100.0/ 100
METRIC RATING
25th/ 347
METRIC RANK
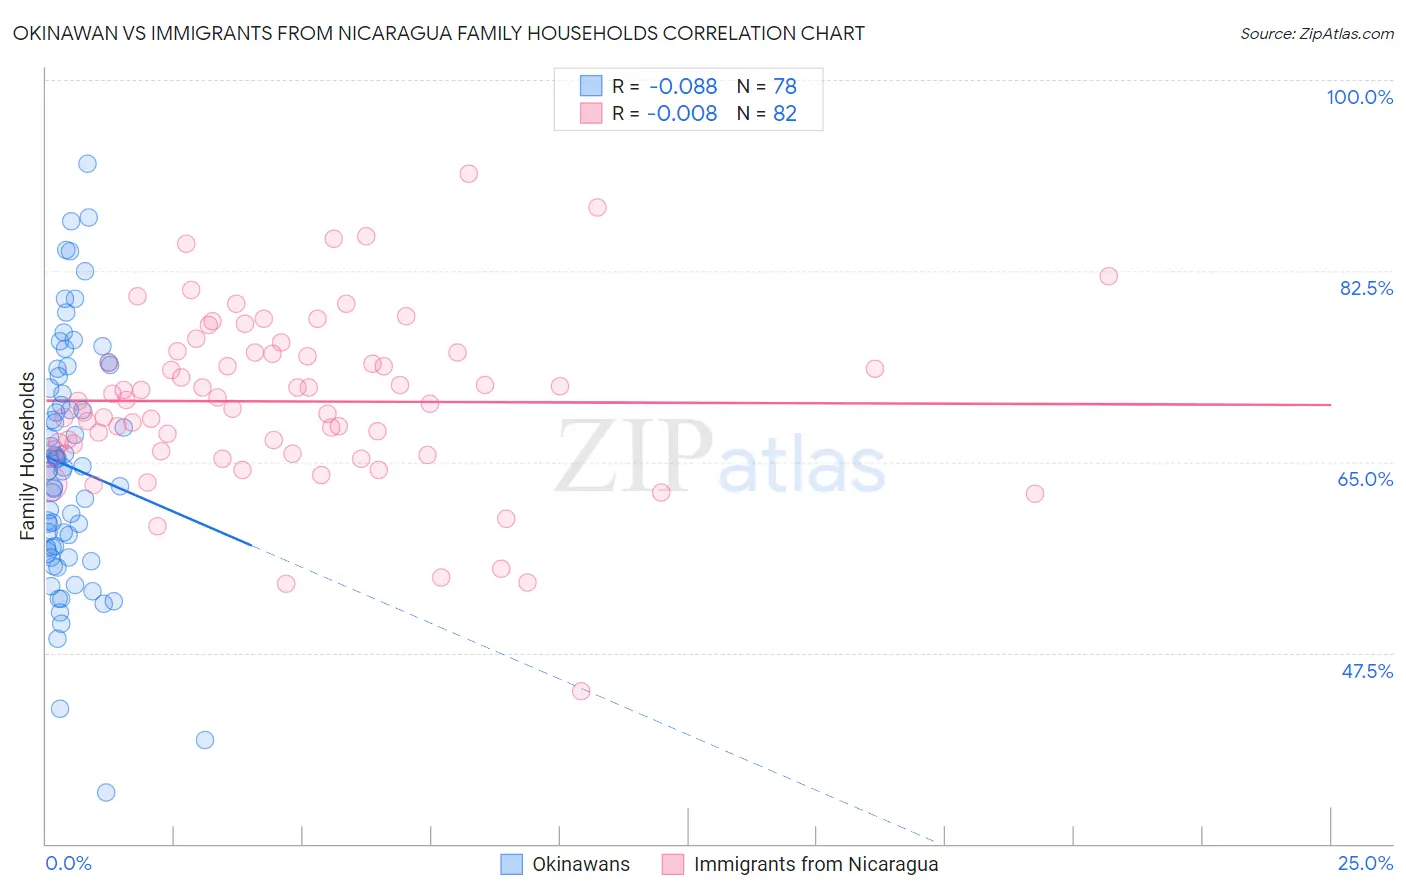
Okinawan vs Immigrants from Nicaragua Family Households Correlation Chart
The statistical analysis conducted on geographies consisting of 73,730,416 people shows a slight negative correlation between the proportion of Okinawans and percentage of family households in the United States with a correlation coefficient (R) of -0.088 and weighted average of 62.5%. Similarly, the statistical analysis conducted on geographies consisting of 236,325,985 people shows no correlation between the proportion of Immigrants from Nicaragua and percentage of family households in the United States with a correlation coefficient (R) of -0.008 and weighted average of 67.5%, a difference of 8.0%.
Family Households Correlation Summary
| Measurement | Okinawan | Immigrants from Nicaragua |
| Minimum | 34.7% | 43.9% |
| Maximum | 92.3% | 91.5% |
| Range | 57.6% | 47.5% |
| Mean | 64.6% | 70.5% |
| Median | 64.3% | 70.7% |
| Interquartile 25% (IQ1) | 57.1% | 66.0% |
| Interquartile 75% (IQ3) | 71.8% | 75.0% |
| Interquartile Range (IQR) | 14.6% | 9.0% |
| Standard Deviation (Sample) | 11.1% | 8.0% |
| Standard Deviation (Population) | 11.0% | 7.9% |
Similar Demographics by Family Households
Demographics Similar to Okinawans by Family Households
In terms of family households, the demographic groups most similar to Okinawans are Barbadian (62.5%, a difference of 0.010%), Slovene (62.4%, a difference of 0.010%), French American Indian (62.4%, a difference of 0.020%), Immigrants from Spain (62.4%, a difference of 0.050%), and Immigrants from Sweden (62.5%, a difference of 0.080%).
| Demographics | Rating | Rank | Family Households |
| Immigrants | Uganda | 0.1 /100 | #288 | Tragic 62.7% |
| Immigrants | Nepal | 0.1 /100 | #289 | Tragic 62.7% |
| Immigrants | Grenada | 0.0 /100 | #290 | Tragic 62.6% |
| U.S. Virgin Islanders | 0.0 /100 | #291 | Tragic 62.6% |
| Immigrants | Burma/Myanmar | 0.0 /100 | #292 | Tragic 62.6% |
| Immigrants | Sweden | 0.0 /100 | #293 | Tragic 62.5% |
| Barbadians | 0.0 /100 | #294 | Tragic 62.5% |
| Okinawans | 0.0 /100 | #295 | Tragic 62.5% |
| Slovenes | 0.0 /100 | #296 | Tragic 62.4% |
| French American Indians | 0.0 /100 | #297 | Tragic 62.4% |
| Immigrants | Spain | 0.0 /100 | #298 | Tragic 62.4% |
| Immigrants | Kuwait | 0.0 /100 | #299 | Tragic 62.4% |
| Immigrants | Africa | 0.0 /100 | #300 | Tragic 62.4% |
| Immigrants | Albania | 0.0 /100 | #301 | Tragic 62.4% |
| Immigrants | Kenya | 0.0 /100 | #302 | Tragic 62.3% |
Demographics Similar to Immigrants from Nicaragua by Family Households
In terms of family households, the demographic groups most similar to Immigrants from Nicaragua are Immigrants from India (67.4%, a difference of 0.010%), Immigrants from South Eastern Asia (67.5%, a difference of 0.020%), Hispanic or Latino (67.4%, a difference of 0.050%), Hawaiian (67.4%, a difference of 0.070%), and Nicaraguan (67.4%, a difference of 0.14%).
| Demographics | Rating | Rank | Family Households |
| Immigrants | Taiwan | 100.0 /100 | #18 | Exceptional 68.0% |
| Samoans | 100.0 /100 | #19 | Exceptional 67.9% |
| Inupiat | 100.0 /100 | #20 | Exceptional 67.8% |
| Cubans | 100.0 /100 | #21 | Exceptional 67.7% |
| Sri Lankans | 100.0 /100 | #22 | Exceptional 67.7% |
| Immigrants | Pakistan | 100.0 /100 | #23 | Exceptional 67.7% |
| Immigrants | South Eastern Asia | 100.0 /100 | #24 | Exceptional 67.5% |
| Immigrants | Nicaragua | 100.0 /100 | #25 | Exceptional 67.5% |
| Immigrants | India | 100.0 /100 | #26 | Exceptional 67.4% |
| Hispanics or Latinos | 100.0 /100 | #27 | Exceptional 67.4% |
| Hawaiians | 100.0 /100 | #28 | Exceptional 67.4% |
| Nicaraguans | 100.0 /100 | #29 | Exceptional 67.4% |
| Immigrants | Peru | 100.0 /100 | #30 | Exceptional 67.2% |
| Immigrants | Latin America | 100.0 /100 | #31 | Exceptional 67.2% |
| Nepalese | 100.0 /100 | #32 | Exceptional 67.2% |