Albanian vs Immigrants from China Single Mother Households
COMPARE
Albanian
Immigrants from China
Single Mother Households
Single Mother Households Comparison
Albanians
Immigrants from China
5.9%
SINGLE MOTHER HOUSEHOLDS
91.1/ 100
METRIC RATING
132nd/ 347
METRIC RANK
5.1%
SINGLE MOTHER HOUSEHOLDS
99.9/ 100
METRIC RATING
11th/ 347
METRIC RANK
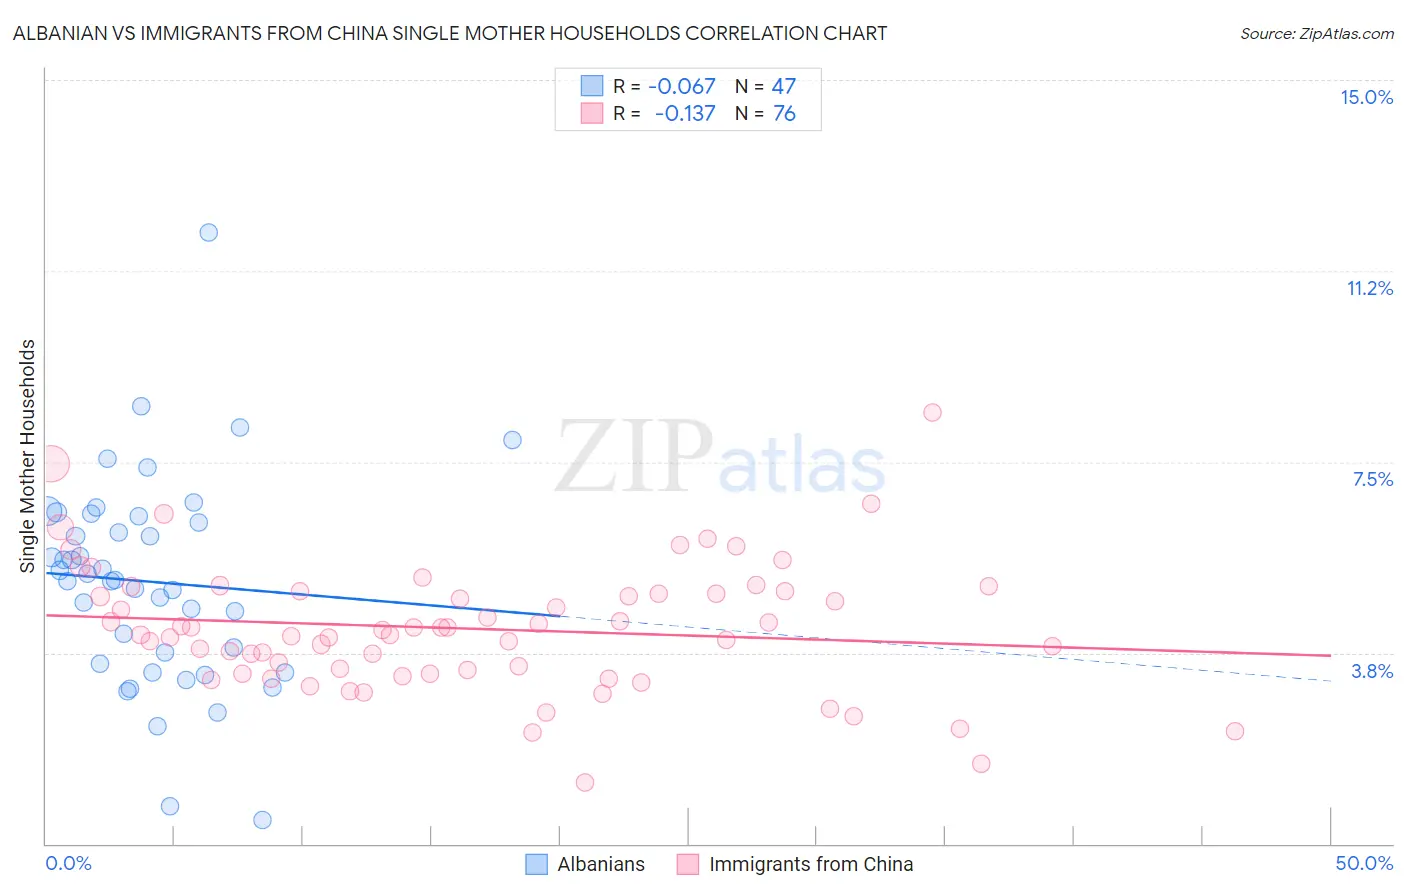
Albanian vs Immigrants from China Single Mother Households Correlation Chart
The statistical analysis conducted on geographies consisting of 193,011,993 people shows a slight negative correlation between the proportion of Albanians and percentage of single mother households in the United States with a correlation coefficient (R) of -0.067 and weighted average of 5.9%. Similarly, the statistical analysis conducted on geographies consisting of 455,104,054 people shows a poor negative correlation between the proportion of Immigrants from China and percentage of single mother households in the United States with a correlation coefficient (R) of -0.137 and weighted average of 5.1%, a difference of 16.8%.
Single Mother Households Correlation Summary
| Measurement | Albanian | Immigrants from China |
| Minimum | 0.45% | 1.2% |
| Maximum | 12.0% | 8.5% |
| Range | 11.6% | 7.3% |
| Mean | 5.1% | 4.2% |
| Median | 5.2% | 4.1% |
| Interquartile 25% (IQ1) | 3.5% | 3.4% |
| Interquartile 75% (IQ3) | 6.4% | 4.9% |
| Interquartile Range (IQR) | 2.9% | 1.6% |
| Standard Deviation (Sample) | 2.1% | 1.3% |
| Standard Deviation (Population) | 2.0% | 1.3% |
Similar Demographics by Single Mother Households
Demographics Similar to Albanians by Single Mother Households
In terms of single mother households, the demographic groups most similar to Albanians are Immigrants from Spain (5.9%, a difference of 0.040%), Egyptian (5.9%, a difference of 0.15%), Canadian (5.9%, a difference of 0.22%), Immigrants from Saudi Arabia (5.9%, a difference of 0.31%), and Palestinian (5.9%, a difference of 0.39%).
| Demographics | Rating | Rank | Single Mother Households |
| Slavs | 92.9 /100 | #125 | Exceptional 5.9% |
| Welsh | 92.8 /100 | #126 | Exceptional 5.9% |
| Lebanese | 92.4 /100 | #127 | Exceptional 5.9% |
| Czechoslovakians | 92.2 /100 | #128 | Exceptional 5.9% |
| Immigrants | Bolivia | 92.2 /100 | #129 | Exceptional 5.9% |
| Palestinians | 92.1 /100 | #130 | Exceptional 5.9% |
| Immigrants | Spain | 91.2 /100 | #131 | Exceptional 5.9% |
| Albanians | 91.1 /100 | #132 | Exceptional 5.9% |
| Egyptians | 90.7 /100 | #133 | Exceptional 5.9% |
| Canadians | 90.5 /100 | #134 | Exceptional 5.9% |
| Immigrants | Saudi Arabia | 90.2 /100 | #135 | Exceptional 5.9% |
| Jordanians | 88.9 /100 | #136 | Excellent 6.0% |
| Immigrants | Pakistan | 88.4 /100 | #137 | Excellent 6.0% |
| Icelanders | 86.9 /100 | #138 | Excellent 6.0% |
| Syrians | 86.0 /100 | #139 | Excellent 6.0% |
Demographics Similar to Immigrants from China by Single Mother Households
In terms of single mother households, the demographic groups most similar to Immigrants from China are Cypriot (5.1%, a difference of 0.18%), Immigrants from India (5.1%, a difference of 0.30%), Immigrants from Israel (5.0%, a difference of 0.63%), Immigrants from Australia (5.1%, a difference of 0.63%), and Immigrants from Eastern Asia (5.1%, a difference of 0.72%).
| Demographics | Rating | Rank | Single Mother Households |
| Assyrians/Chaldeans/Syriacs | 100.0 /100 | #4 | Exceptional 4.8% |
| Immigrants | Hong Kong | 100.0 /100 | #5 | Exceptional 4.8% |
| Immigrants | Singapore | 100.0 /100 | #6 | Exceptional 5.0% |
| Iranians | 100.0 /100 | #7 | Exceptional 5.0% |
| Immigrants | Ireland | 99.9 /100 | #8 | Exceptional 5.0% |
| Okinawans | 99.9 /100 | #9 | Exceptional 5.0% |
| Immigrants | Israel | 99.9 /100 | #10 | Exceptional 5.0% |
| Immigrants | China | 99.9 /100 | #11 | Exceptional 5.1% |
| Cypriots | 99.9 /100 | #12 | Exceptional 5.1% |
| Immigrants | India | 99.9 /100 | #13 | Exceptional 5.1% |
| Immigrants | Australia | 99.9 /100 | #14 | Exceptional 5.1% |
| Immigrants | Eastern Asia | 99.9 /100 | #15 | Exceptional 5.1% |
| Indians (Asian) | 99.9 /100 | #16 | Exceptional 5.1% |
| Soviet Union | 99.9 /100 | #17 | Exceptional 5.1% |
| Immigrants | Armenia | 99.9 /100 | #18 | Exceptional 5.2% |