Alaska Native vs Potawatomi Births to Unmarried Women
COMPARE
Alaska Native
Potawatomi
Births to Unmarried Women
Births to Unmarried Women Comparison
Alaska Natives
Potawatomi
38.3%
BIRTHS TO UNMARRIED WOMEN
0.0/ 100
METRIC RATING
296th/ 347
METRIC RANK
36.2%
BIRTHS TO UNMARRIED WOMEN
0.2/ 100
METRIC RATING
254th/ 347
METRIC RANK
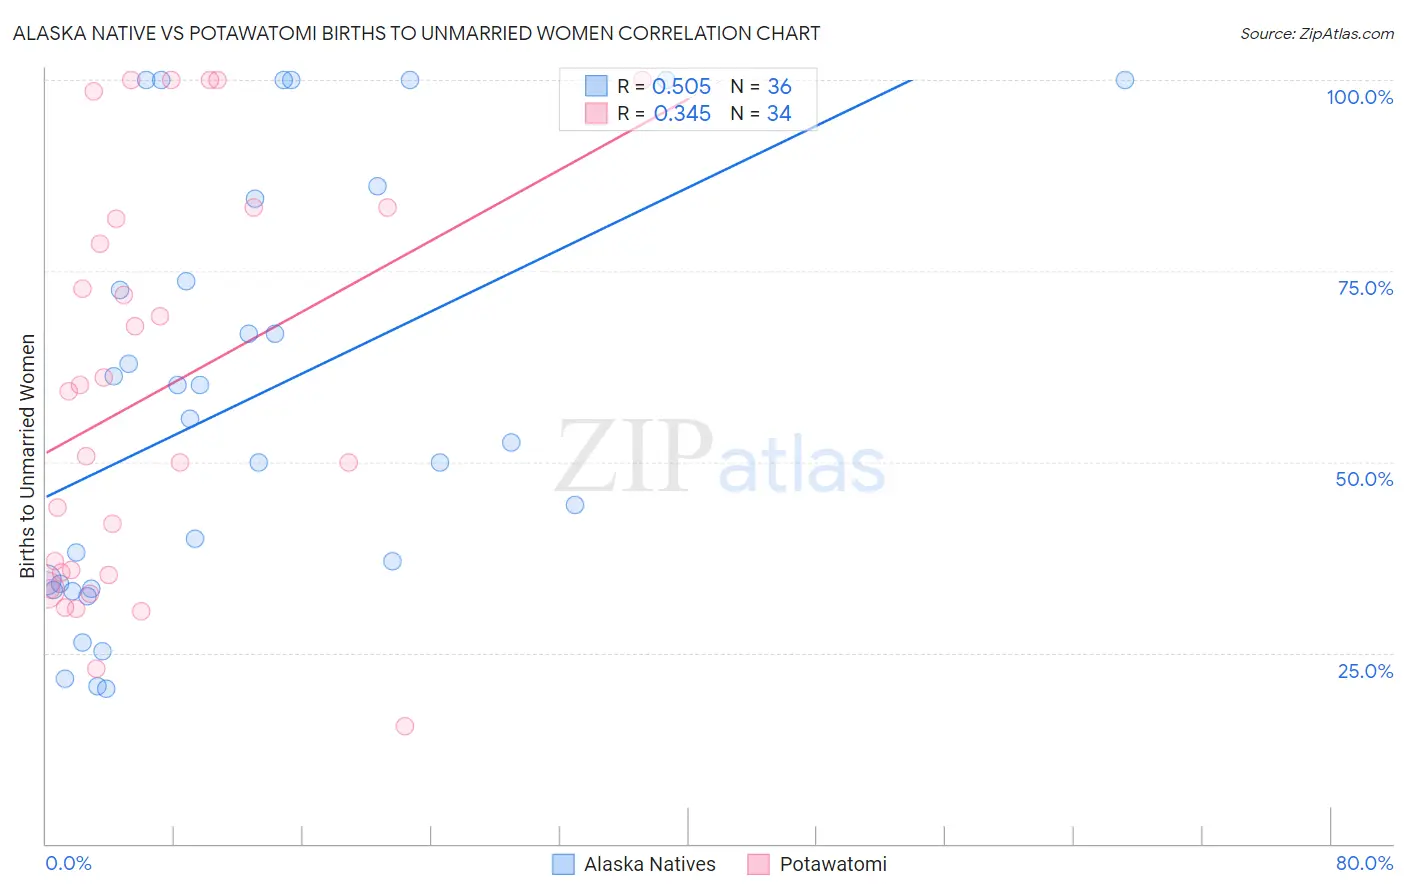
Alaska Native vs Potawatomi Births to Unmarried Women Correlation Chart
The statistical analysis conducted on geographies consisting of 75,658,541 people shows a substantial positive correlation between the proportion of Alaska Natives and percentage of births to unmarried women in the United States with a correlation coefficient (R) of 0.505 and weighted average of 38.3%. Similarly, the statistical analysis conducted on geographies consisting of 115,144,895 people shows a mild positive correlation between the proportion of Potawatomi and percentage of births to unmarried women in the United States with a correlation coefficient (R) of 0.345 and weighted average of 36.2%, a difference of 5.7%.
Births to Unmarried Women Correlation Summary
| Measurement | Alaska Native | Potawatomi |
| Minimum | 20.3% | 15.4% |
| Maximum | 100.0% | 100.0% |
| Range | 79.7% | 84.6% |
| Mean | 57.7% | 58.7% |
| Median | 54.1% | 55.0% |
| Interquartile 25% (IQ1) | 33.8% | 35.2% |
| Interquartile 75% (IQ3) | 79.0% | 81.8% |
| Interquartile Range (IQR) | 45.3% | 46.6% |
| Standard Deviation (Sample) | 27.2% | 26.4% |
| Standard Deviation (Population) | 26.8% | 26.1% |
Similar Demographics by Births to Unmarried Women
Demographics Similar to Alaska Natives by Births to Unmarried Women
In terms of births to unmarried women, the demographic groups most similar to Alaska Natives are Iroquois (38.2%, a difference of 0.24%), Dutch West Indian (38.4%, a difference of 0.28%), Jamaican (38.5%, a difference of 0.48%), Spanish American (38.6%, a difference of 0.68%), and Immigrants from West Indies (38.6%, a difference of 0.74%).
| Demographics | Rating | Rank | Births to Unmarried Women |
| Alaskan Athabascans | 0.0 /100 | #289 | Tragic 37.7% |
| Hispanics or Latinos | 0.0 /100 | #290 | Tragic 37.8% |
| Seminole | 0.0 /100 | #291 | Tragic 37.9% |
| Blackfeet | 0.0 /100 | #292 | Tragic 37.9% |
| Immigrants | Nicaragua | 0.0 /100 | #293 | Tragic 38.0% |
| British West Indians | 0.0 /100 | #294 | Tragic 38.0% |
| Iroquois | 0.0 /100 | #295 | Tragic 38.2% |
| Alaska Natives | 0.0 /100 | #296 | Tragic 38.3% |
| Dutch West Indians | 0.0 /100 | #297 | Tragic 38.4% |
| Jamaicans | 0.0 /100 | #298 | Tragic 38.5% |
| Spanish Americans | 0.0 /100 | #299 | Tragic 38.6% |
| Immigrants | West Indies | 0.0 /100 | #300 | Tragic 38.6% |
| Haitians | 0.0 /100 | #301 | Tragic 38.6% |
| Hondurans | 0.0 /100 | #302 | Tragic 38.7% |
| Immigrants | Jamaica | 0.0 /100 | #303 | Tragic 38.8% |
Demographics Similar to Potawatomi by Births to Unmarried Women
In terms of births to unmarried women, the demographic groups most similar to Potawatomi are Chickasaw (36.3%, a difference of 0.14%), Immigrants from Trinidad and Tobago (36.3%, a difference of 0.14%), Immigrants from Grenada (36.3%, a difference of 0.16%), Immigrants from Portugal (36.2%, a difference of 0.22%), and American (36.4%, a difference of 0.45%).
| Demographics | Rating | Rank | Births to Unmarried Women |
| Immigrants | Nigeria | 0.7 /100 | #247 | Tragic 35.4% |
| Immigrants | Nonimmigrants | 0.6 /100 | #248 | Tragic 35.5% |
| Bermudans | 0.6 /100 | #249 | Tragic 35.5% |
| Mexican American Indians | 0.4 /100 | #250 | Tragic 35.7% |
| Immigrants | Western Africa | 0.3 /100 | #251 | Tragic 36.0% |
| Salvadorans | 0.3 /100 | #252 | Tragic 36.0% |
| Immigrants | Portugal | 0.2 /100 | #253 | Tragic 36.2% |
| Potawatomi | 0.2 /100 | #254 | Tragic 36.2% |
| Chickasaw | 0.2 /100 | #255 | Tragic 36.3% |
| Immigrants | Trinidad and Tobago | 0.2 /100 | #256 | Tragic 36.3% |
| Immigrants | Grenada | 0.2 /100 | #257 | Tragic 36.3% |
| Americans | 0.2 /100 | #258 | Tragic 36.4% |
| Immigrants | El Salvador | 0.2 /100 | #259 | Tragic 36.4% |
| Ottawa | 0.2 /100 | #260 | Tragic 36.5% |
| Trinidadians and Tobagonians | 0.2 /100 | #261 | Tragic 36.5% |