Immigrants from Senegal vs Potawatomi Births to Unmarried Women
COMPARE
Immigrants from Senegal
Potawatomi
Births to Unmarried Women
Births to Unmarried Women Comparison
Immigrants from Senegal
Potawatomi
36.7%
BIRTHS TO UNMARRIED WOMEN
0.1/ 100
METRIC RATING
266th/ 347
METRIC RANK
36.2%
BIRTHS TO UNMARRIED WOMEN
0.2/ 100
METRIC RATING
254th/ 347
METRIC RANK
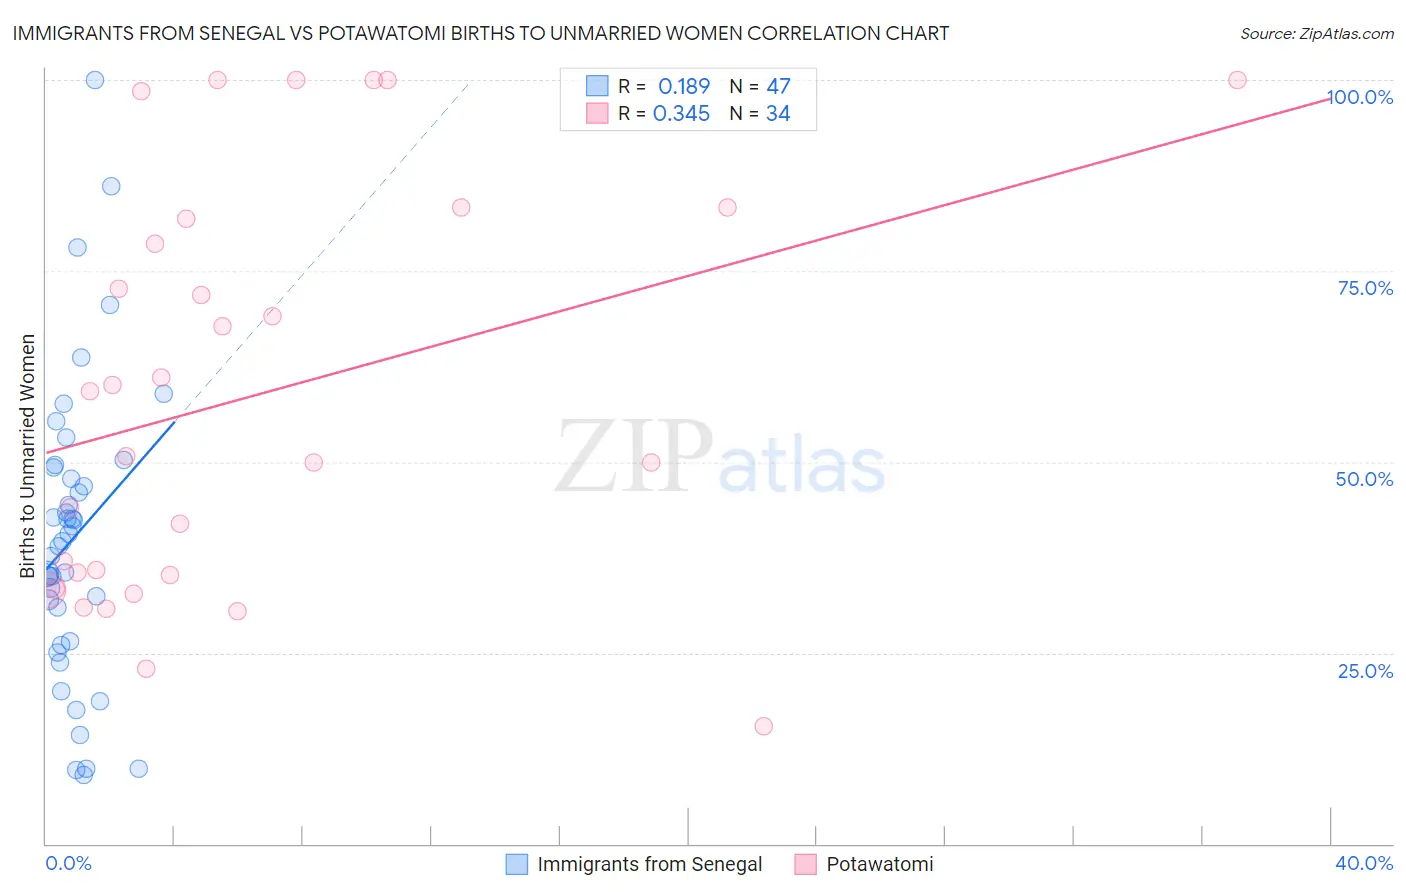
Immigrants from Senegal vs Potawatomi Births to Unmarried Women Correlation Chart
The statistical analysis conducted on geographies consisting of 88,702,422 people shows a poor positive correlation between the proportion of Immigrants from Senegal and percentage of births to unmarried women in the United States with a correlation coefficient (R) of 0.189 and weighted average of 36.7%. Similarly, the statistical analysis conducted on geographies consisting of 115,144,895 people shows a mild positive correlation between the proportion of Potawatomi and percentage of births to unmarried women in the United States with a correlation coefficient (R) of 0.345 and weighted average of 36.2%, a difference of 1.2%.
Births to Unmarried Women Correlation Summary
| Measurement | Immigrants from Senegal | Potawatomi |
| Minimum | 9.0% | 15.4% |
| Maximum | 100.0% | 100.0% |
| Range | 91.0% | 84.6% |
| Mean | 40.1% | 58.7% |
| Median | 39.5% | 55.0% |
| Interquartile 25% (IQ1) | 26.5% | 35.2% |
| Interquartile 75% (IQ3) | 49.2% | 81.8% |
| Interquartile Range (IQR) | 22.8% | 46.6% |
| Standard Deviation (Sample) | 19.3% | 26.4% |
| Standard Deviation (Population) | 19.1% | 26.1% |
Demographics Similar to Immigrants from Senegal and Potawatomi by Births to Unmarried Women
In terms of births to unmarried women, the demographic groups most similar to Immigrants from Senegal are Cherokee (36.7%, a difference of 0.050%), Central American (36.7%, a difference of 0.070%), Comanche (36.7%, a difference of 0.080%), Subsaharan African (36.7%, a difference of 0.10%), and Senegalese (36.8%, a difference of 0.20%). Similarly, the demographic groups most similar to Potawatomi are Chickasaw (36.3%, a difference of 0.14%), Immigrants from Trinidad and Tobago (36.3%, a difference of 0.14%), Immigrants from Grenada (36.3%, a difference of 0.16%), Immigrants from Portugal (36.2%, a difference of 0.22%), and American (36.4%, a difference of 0.45%).
| Demographics | Rating | Rank | Births to Unmarried Women |
| Mexican American Indians | 0.4 /100 | #250 | Tragic 35.7% |
| Immigrants | Western Africa | 0.3 /100 | #251 | Tragic 36.0% |
| Salvadorans | 0.3 /100 | #252 | Tragic 36.0% |
| Immigrants | Portugal | 0.2 /100 | #253 | Tragic 36.2% |
| Potawatomi | 0.2 /100 | #254 | Tragic 36.2% |
| Chickasaw | 0.2 /100 | #255 | Tragic 36.3% |
| Immigrants | Trinidad and Tobago | 0.2 /100 | #256 | Tragic 36.3% |
| Immigrants | Grenada | 0.2 /100 | #257 | Tragic 36.3% |
| Americans | 0.2 /100 | #258 | Tragic 36.4% |
| Immigrants | El Salvador | 0.2 /100 | #259 | Tragic 36.4% |
| Ottawa | 0.2 /100 | #260 | Tragic 36.5% |
| Trinidadians and Tobagonians | 0.2 /100 | #261 | Tragic 36.5% |
| French American Indians | 0.1 /100 | #262 | Tragic 36.6% |
| Nicaraguans | 0.1 /100 | #263 | Tragic 36.6% |
| Sub-Saharan Africans | 0.1 /100 | #264 | Tragic 36.7% |
| Cherokee | 0.1 /100 | #265 | Tragic 36.7% |
| Immigrants | Senegal | 0.1 /100 | #266 | Tragic 36.7% |
| Central Americans | 0.1 /100 | #267 | Tragic 36.7% |
| Comanche | 0.1 /100 | #268 | Tragic 36.7% |
| Senegalese | 0.1 /100 | #269 | Tragic 36.8% |
| Immigrants | Congo | 0.1 /100 | #270 | Tragic 36.8% |