African vs Immigrants from Portugal Single Mother Households
COMPARE
African
Immigrants from Portugal
Single Mother Households
Single Mother Households Comparison
Africans
Immigrants from Portugal
8.2%
SINGLE MOTHER HOUSEHOLDS
0.0/ 100
METRIC RATING
316th/ 347
METRIC RANK
7.2%
SINGLE MOTHER HOUSEHOLDS
0.6/ 100
METRIC RATING
241st/ 347
METRIC RANK
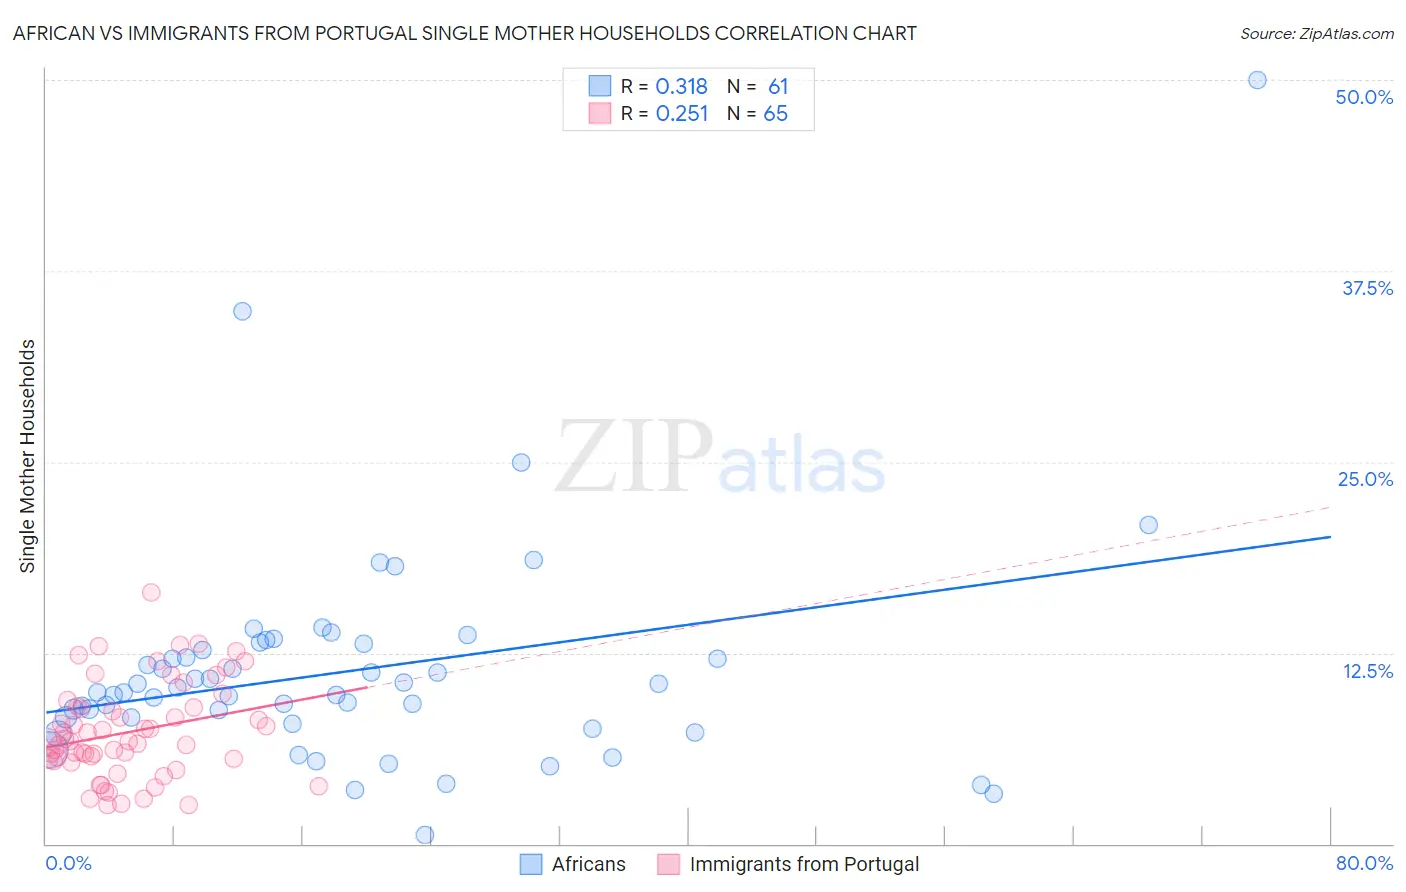
African vs Immigrants from Portugal Single Mother Households Correlation Chart
The statistical analysis conducted on geographies consisting of 468,558,446 people shows a mild positive correlation between the proportion of Africans and percentage of single mother households in the United States with a correlation coefficient (R) of 0.318 and weighted average of 8.2%. Similarly, the statistical analysis conducted on geographies consisting of 174,517,649 people shows a weak positive correlation between the proportion of Immigrants from Portugal and percentage of single mother households in the United States with a correlation coefficient (R) of 0.251 and weighted average of 7.2%, a difference of 13.8%.
Single Mother Households Correlation Summary
| Measurement | African | Immigrants from Portugal |
| Minimum | 0.60% | 2.5% |
| Maximum | 50.0% | 16.4% |
| Range | 49.4% | 13.9% |
| Mean | 11.3% | 7.3% |
| Median | 9.9% | 6.7% |
| Interquartile 25% (IQ1) | 8.1% | 5.5% |
| Interquartile 75% (IQ3) | 12.9% | 9.0% |
| Interquartile Range (IQR) | 4.8% | 3.5% |
| Standard Deviation (Sample) | 7.3% | 3.1% |
| Standard Deviation (Population) | 7.3% | 3.1% |
Similar Demographics by Single Mother Households
Demographics Similar to Africans by Single Mother Households
In terms of single mother households, the demographic groups most similar to Africans are Immigrants from Honduras (8.2%, a difference of 0.14%), Immigrants from Western Africa (8.2%, a difference of 0.15%), Immigrants from Mexico (8.2%, a difference of 0.17%), Immigrants from Grenada (8.2%, a difference of 0.29%), and Bangladeshi (8.1%, a difference of 0.46%).
| Demographics | Rating | Rank | Single Mother Households |
| Cheyenne | 0.0 /100 | #309 | Tragic 8.1% |
| Hondurans | 0.0 /100 | #310 | Tragic 8.1% |
| Immigrants | Congo | 0.0 /100 | #311 | Tragic 8.1% |
| Bangladeshis | 0.0 /100 | #312 | Tragic 8.1% |
| Immigrants | Grenada | 0.0 /100 | #313 | Tragic 8.2% |
| Immigrants | Mexico | 0.0 /100 | #314 | Tragic 8.2% |
| Immigrants | Western Africa | 0.0 /100 | #315 | Tragic 8.2% |
| Africans | 0.0 /100 | #316 | Tragic 8.2% |
| Immigrants | Honduras | 0.0 /100 | #317 | Tragic 8.2% |
| Senegalese | 0.0 /100 | #318 | Tragic 8.2% |
| Jamaicans | 0.0 /100 | #319 | Tragic 8.2% |
| Bahamians | 0.0 /100 | #320 | Tragic 8.3% |
| Immigrants | Senegal | 0.0 /100 | #321 | Tragic 8.3% |
| Pima | 0.0 /100 | #322 | Tragic 8.3% |
| Haitians | 0.0 /100 | #323 | Tragic 8.3% |
Demographics Similar to Immigrants from Portugal by Single Mother Households
In terms of single mother households, the demographic groups most similar to Immigrants from Portugal are Fijian (7.2%, a difference of 0.080%), Ecuadorian (7.2%, a difference of 0.13%), Cuban (7.2%, a difference of 0.19%), Immigrants from Panama (7.2%, a difference of 0.35%), and Immigrants from Cambodia (7.2%, a difference of 0.54%).
| Demographics | Rating | Rank | Single Mother Households |
| Chickasaw | 1.4 /100 | #234 | Tragic 7.0% |
| Immigrants | Burma/Myanmar | 1.4 /100 | #235 | Tragic 7.0% |
| Ute | 1.0 /100 | #236 | Tragic 7.1% |
| Arapaho | 1.0 /100 | #237 | Tragic 7.1% |
| Panamanians | 0.9 /100 | #238 | Tragic 7.1% |
| Kiowa | 0.8 /100 | #239 | Tragic 7.1% |
| Immigrants | Panama | 0.7 /100 | #240 | Tragic 7.2% |
| Immigrants | Portugal | 0.6 /100 | #241 | Tragic 7.2% |
| Fijians | 0.6 /100 | #242 | Tragic 7.2% |
| Ecuadorians | 0.6 /100 | #243 | Tragic 7.2% |
| Cubans | 0.6 /100 | #244 | Tragic 7.2% |
| Immigrants | Cambodia | 0.5 /100 | #245 | Tragic 7.2% |
| Nicaraguans | 0.5 /100 | #246 | Tragic 7.2% |
| Dutch West Indians | 0.4 /100 | #247 | Tragic 7.3% |
| Spanish American Indians | 0.4 /100 | #248 | Tragic 7.3% |