African vs Asian Unemployment Among Women with Children Under 6 years
COMPARE
African
Asian
Unemployment Among Women with Children Under 6 years
Unemployment Among Women with Children Under 6 years Comparison
Africans
Asians
9.2%
UNEMPLOYMENT AMONG WOMEN WITH CHILDREN UNDER 6 YEARS
0.0/ 100
METRIC RATING
309th/ 347
METRIC RANK
6.7%
UNEMPLOYMENT AMONG WOMEN WITH CHILDREN UNDER 6 YEARS
100.0/ 100
METRIC RATING
40th/ 347
METRIC RANK
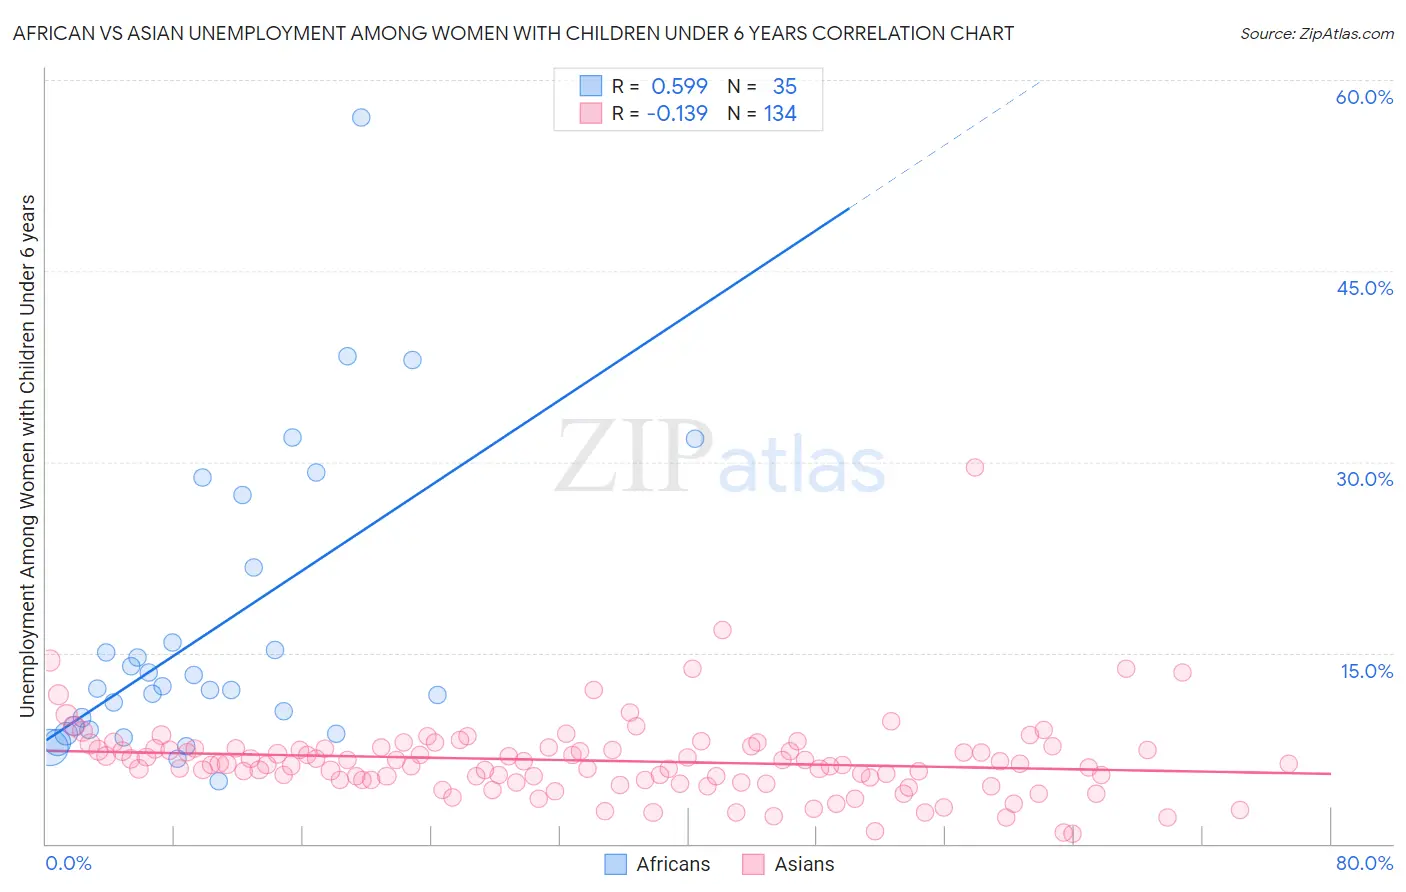
African vs Asian Unemployment Among Women with Children Under 6 years Correlation Chart
The statistical analysis conducted on geographies consisting of 349,649,576 people shows a substantial positive correlation between the proportion of Africans and unemployment rate among women with children under the age of 6 in the United States with a correlation coefficient (R) of 0.599 and weighted average of 9.2%. Similarly, the statistical analysis conducted on geographies consisting of 374,627,418 people shows a poor negative correlation between the proportion of Asians and unemployment rate among women with children under the age of 6 in the United States with a correlation coefficient (R) of -0.139 and weighted average of 6.7%, a difference of 37.3%.
Unemployment Among Women with Children Under 6 years Correlation Summary
| Measurement | African | Asian |
| Minimum | 4.9% | 0.80% |
| Maximum | 57.1% | 29.6% |
| Range | 52.2% | 28.8% |
| Mean | 16.8% | 6.5% |
| Median | 12.2% | 6.3% |
| Interquartile 25% (IQ1) | 8.9% | 5.0% |
| Interquartile 75% (IQ3) | 21.7% | 7.5% |
| Interquartile Range (IQR) | 12.8% | 2.5% |
| Standard Deviation (Sample) | 11.6% | 3.3% |
| Standard Deviation (Population) | 11.4% | 3.3% |
Similar Demographics by Unemployment Among Women with Children Under 6 years
Demographics Similar to Africans by Unemployment Among Women with Children Under 6 years
In terms of unemployment among women with children under 6 years, the demographic groups most similar to Africans are Cajun (9.2%, a difference of 0.13%), Immigrants from Micronesia (9.1%, a difference of 0.39%), French American Indian (9.2%, a difference of 0.41%), Dominican (9.1%, a difference of 0.46%), and Immigrants from the Azores (9.2%, a difference of 0.55%).
| Demographics | Rating | Rank | Unemployment Among Women with Children Under 6 years |
| Hispanics or Latinos | 0.0 /100 | #302 | Tragic 9.0% |
| Immigrants | West Indies | 0.0 /100 | #303 | Tragic 9.0% |
| Immigrants | Mexico | 0.0 /100 | #304 | Tragic 9.1% |
| Alaskan Athabascans | 0.0 /100 | #305 | Tragic 9.1% |
| Pueblo | 0.0 /100 | #306 | Tragic 9.1% |
| Dominicans | 0.0 /100 | #307 | Tragic 9.1% |
| Immigrants | Micronesia | 0.0 /100 | #308 | Tragic 9.1% |
| Africans | 0.0 /100 | #309 | Tragic 9.2% |
| Cajuns | 0.0 /100 | #310 | Tragic 9.2% |
| French American Indians | 0.0 /100 | #311 | Tragic 9.2% |
| Immigrants | Azores | 0.0 /100 | #312 | Tragic 9.2% |
| Americans | 0.0 /100 | #313 | Tragic 9.3% |
| Fijians | 0.0 /100 | #314 | Tragic 9.3% |
| Cherokee | 0.0 /100 | #315 | Tragic 9.3% |
| Houma | 0.0 /100 | #316 | Tragic 9.4% |
Demographics Similar to Asians by Unemployment Among Women with Children Under 6 years
In terms of unemployment among women with children under 6 years, the demographic groups most similar to Asians are Immigrants from Indonesia (6.7%, a difference of 0.16%), Immigrants from Russia (6.7%, a difference of 0.22%), Immigrants from Cuba (6.7%, a difference of 0.26%), Hmong (6.7%, a difference of 0.28%), and Sri Lankan (6.6%, a difference of 0.41%).
| Demographics | Rating | Rank | Unemployment Among Women with Children Under 6 years |
| Immigrants | Vietnam | 100.0 /100 | #33 | Exceptional 6.6% |
| Immigrants | South Central Asia | 100.0 /100 | #34 | Exceptional 6.6% |
| Yakama | 100.0 /100 | #35 | Exceptional 6.6% |
| Luxembourgers | 100.0 /100 | #36 | Exceptional 6.6% |
| Sri Lankans | 100.0 /100 | #37 | Exceptional 6.6% |
| Hmong | 100.0 /100 | #38 | Exceptional 6.7% |
| Immigrants | Russia | 100.0 /100 | #39 | Exceptional 6.7% |
| Asians | 100.0 /100 | #40 | Exceptional 6.7% |
| Immigrants | Indonesia | 99.9 /100 | #41 | Exceptional 6.7% |
| Immigrants | Cuba | 99.9 /100 | #42 | Exceptional 6.7% |
| Bhutanese | 99.9 /100 | #43 | Exceptional 6.7% |
| Iranians | 99.9 /100 | #44 | Exceptional 6.7% |
| Immigrants | Australia | 99.9 /100 | #45 | Exceptional 6.8% |
| Latvians | 99.9 /100 | #46 | Exceptional 6.8% |
| Immigrants | Asia | 99.9 /100 | #47 | Exceptional 6.8% |