Yup'ik vs Immigrants from North America Median Earnings
COMPARE
Yup'ik
Immigrants from North America
Median Earnings
Median Earnings Comparison
Yup'ik
Immigrants from North America
$35,942
MEDIAN EARNINGS
0.0/ 100
METRIC RATING
346th/ 347
METRIC RANK
$50,108
MEDIAN EARNINGS
99.4/ 100
METRIC RATING
89th/ 347
METRIC RANK
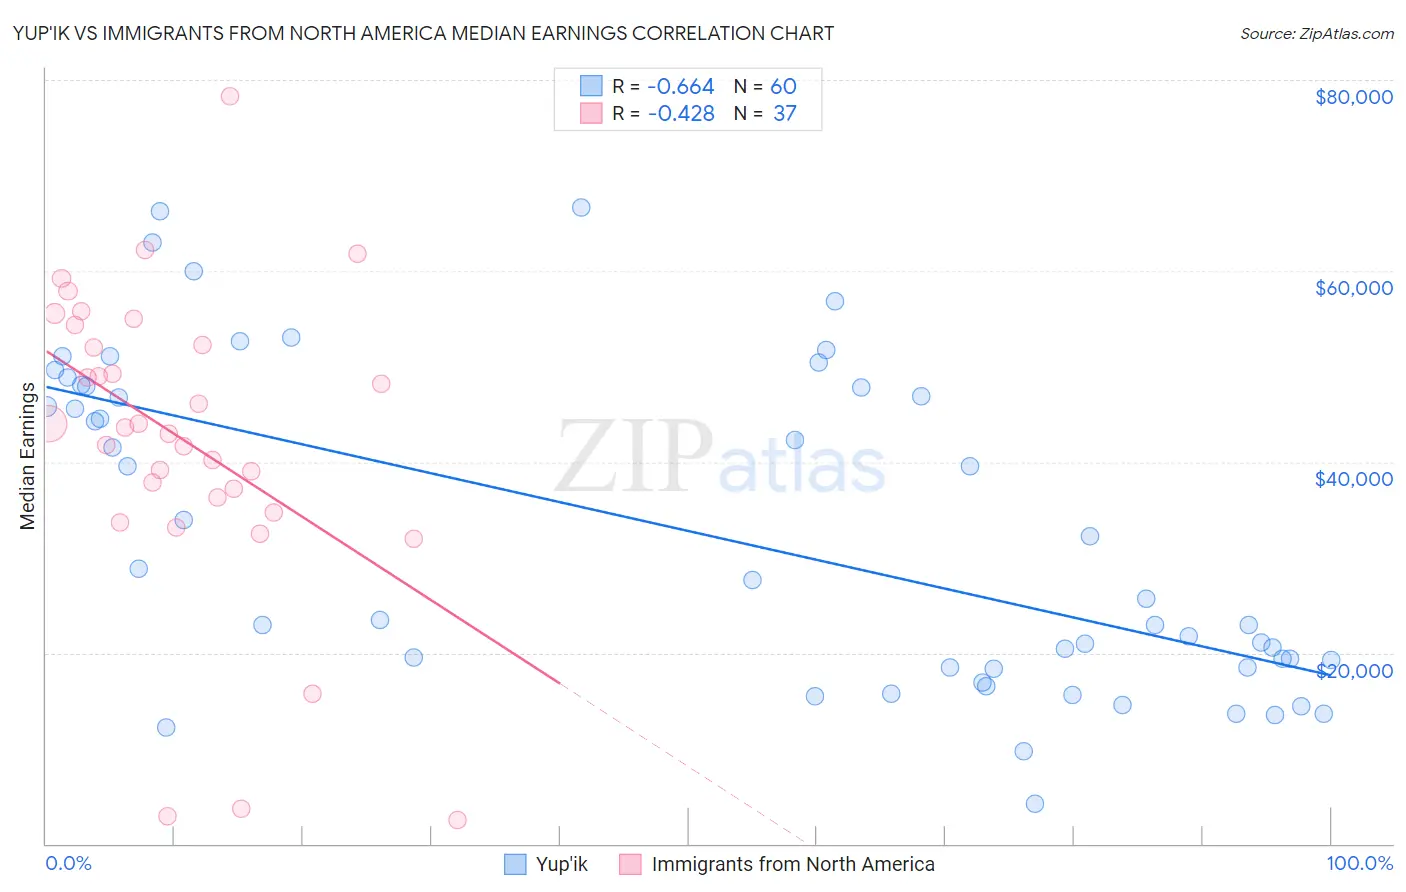
Yup'ik vs Immigrants from North America Median Earnings Correlation Chart
The statistical analysis conducted on geographies consisting of 39,954,452 people shows a significant negative correlation between the proportion of Yup'ik and median earnings in the United States with a correlation coefficient (R) of -0.664 and weighted average of $35,942. Similarly, the statistical analysis conducted on geographies consisting of 462,391,423 people shows a moderate negative correlation between the proportion of Immigrants from North America and median earnings in the United States with a correlation coefficient (R) of -0.428 and weighted average of $50,108, a difference of 39.4%.
Median Earnings Correlation Summary
| Measurement | Yup'ik | Immigrants from North America |
| Minimum | $4,192 | $2,499 |
| Maximum | $66,667 | $78,310 |
| Range | $62,475 | $75,811 |
| Mean | $32,584 | $42,268 |
| Median | $26,644 | $43,536 |
| Interquartile 25% (IQ1) | $18,448 | $35,442 |
| Interquartile 75% (IQ3) | $47,862 | $53,269 |
| Interquartile Range (IQR) | $29,414 | $17,827 |
| Standard Deviation (Sample) | $16,777 | $16,254 |
| Standard Deviation (Population) | $16,637 | $16,033 |
Similar Demographics by Median Earnings
Demographics Similar to Yup'ik by Median Earnings
In terms of median earnings, the demographic groups most similar to Yup'ik are Puerto Rican ($35,560, a difference of 1.1%), Tohono O'odham ($36,349, a difference of 1.1%), Arapaho ($36,586, a difference of 1.8%), Pueblo ($36,859, a difference of 2.5%), and Hopi ($36,871, a difference of 2.6%).
| Demographics | Rating | Rank | Median Earnings |
| Houma | 0.0 /100 | #333 | Tragic $38,949 |
| Spanish American Indians | 0.0 /100 | #334 | Tragic $38,907 |
| Natives/Alaskans | 0.0 /100 | #335 | Tragic $38,896 |
| Crow | 0.0 /100 | #336 | Tragic $38,707 |
| Immigrants | Cuba | 0.0 /100 | #337 | Tragic $38,426 |
| Pima | 0.0 /100 | #338 | Tragic $38,285 |
| Menominee | 0.0 /100 | #339 | Tragic $37,884 |
| Navajo | 0.0 /100 | #340 | Tragic $36,999 |
| Lumbee | 0.0 /100 | #341 | Tragic $36,876 |
| Hopi | 0.0 /100 | #342 | Tragic $36,871 |
| Pueblo | 0.0 /100 | #343 | Tragic $36,859 |
| Arapaho | 0.0 /100 | #344 | Tragic $36,586 |
| Tohono O'odham | 0.0 /100 | #345 | Tragic $36,349 |
| Yup'ik | 0.0 /100 | #346 | Tragic $35,942 |
| Puerto Ricans | 0.0 /100 | #347 | Tragic $35,560 |
Demographics Similar to Immigrants from North America by Median Earnings
In terms of median earnings, the demographic groups most similar to Immigrants from North America are Albanian ($50,116, a difference of 0.020%), Immigrants from Uzbekistan ($50,151, a difference of 0.090%), Immigrants from Canada ($50,192, a difference of 0.17%), Immigrants from Kazakhstan ($50,225, a difference of 0.23%), and Immigrants from Hungary ($50,227, a difference of 0.24%).
| Demographics | Rating | Rank | Median Earnings |
| Immigrants | Moldova | 99.5 /100 | #82 | Exceptional $50,274 |
| Romanians | 99.5 /100 | #83 | Exceptional $50,244 |
| Immigrants | Hungary | 99.5 /100 | #84 | Exceptional $50,227 |
| Immigrants | Kazakhstan | 99.5 /100 | #85 | Exceptional $50,225 |
| Immigrants | Canada | 99.5 /100 | #86 | Exceptional $50,192 |
| Immigrants | Uzbekistan | 99.5 /100 | #87 | Exceptional $50,151 |
| Albanians | 99.4 /100 | #88 | Exceptional $50,116 |
| Immigrants | North America | 99.4 /100 | #89 | Exceptional $50,108 |
| Italians | 99.3 /100 | #90 | Exceptional $49,915 |
| Macedonians | 99.2 /100 | #91 | Exceptional $49,893 |
| Immigrants | Argentina | 99.2 /100 | #92 | Exceptional $49,841 |
| Armenians | 99.1 /100 | #93 | Exceptional $49,804 |
| Croatians | 99.0 /100 | #94 | Exceptional $49,724 |
| Immigrants | England | 99.0 /100 | #95 | Exceptional $49,722 |
| Immigrants | Lebanon | 99.0 /100 | #96 | Exceptional $49,682 |