Central American Indian vs Estonian 8th Grade
COMPARE
Central American Indian
Estonian
8th Grade
8th Grade Comparison
Central American Indians
Estonians
92.7%
8TH GRADE
0.0/ 100
METRIC RATING
326th/ 347
METRIC RANK
96.8%
8TH GRADE
99.9/ 100
METRIC RATING
49th/ 347
METRIC RANK
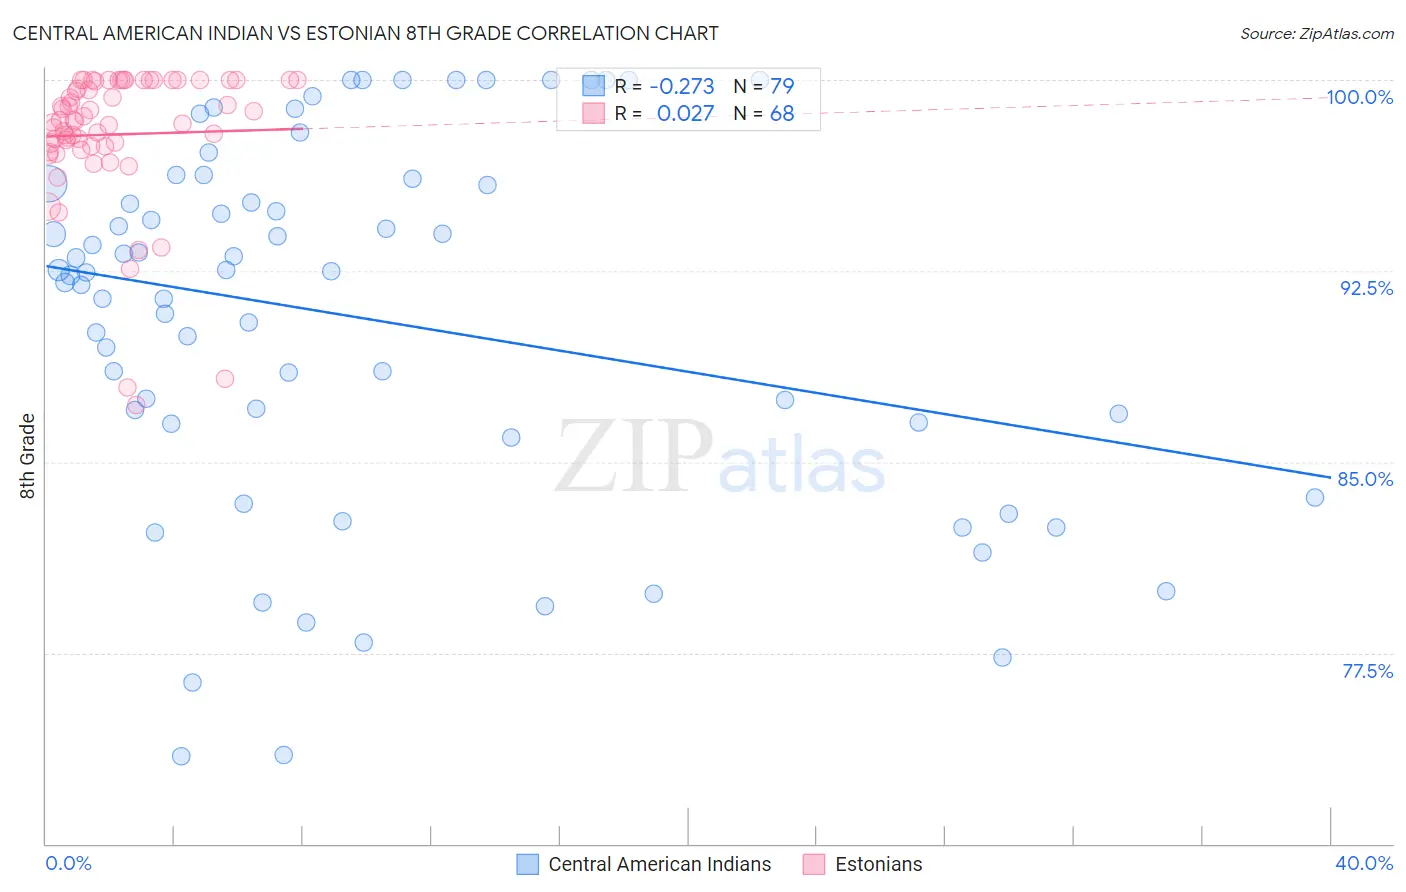
Central American Indian vs Estonian 8th Grade Correlation Chart
The statistical analysis conducted on geographies consisting of 326,142,643 people shows a weak negative correlation between the proportion of Central American Indians and percentage of population with at least 8th grade education in the United States with a correlation coefficient (R) of -0.273 and weighted average of 92.7%. Similarly, the statistical analysis conducted on geographies consisting of 123,528,404 people shows no correlation between the proportion of Estonians and percentage of population with at least 8th grade education in the United States with a correlation coefficient (R) of 0.027 and weighted average of 96.8%, a difference of 4.4%.
8th Grade Correlation Summary
| Measurement | Central American Indian | Estonian |
| Minimum | 73.4% | 87.2% |
| Maximum | 100.0% | 100.0% |
| Range | 26.6% | 12.8% |
| Mean | 90.6% | 97.9% |
| Median | 92.4% | 98.4% |
| Interquartile 25% (IQ1) | 86.5% | 97.4% |
| Interquartile 75% (IQ3) | 95.9% | 100.0% |
| Interquartile Range (IQR) | 9.5% | 2.6% |
| Standard Deviation (Sample) | 7.2% | 2.8% |
| Standard Deviation (Population) | 7.1% | 2.7% |
Similar Demographics by 8th Grade
Demographics Similar to Central American Indians by 8th Grade
In terms of 8th grade, the demographic groups most similar to Central American Indians are Dominican (92.8%, a difference of 0.050%), Nepalese (92.8%, a difference of 0.14%), Immigrants from Belize (92.9%, a difference of 0.21%), Immigrants from the Azores (92.5%, a difference of 0.25%), and Nicaraguan (93.0%, a difference of 0.26%).
| Demographics | Rating | Rank | 8th Grade |
| Immigrants | Cuba | 0.0 /100 | #319 | Tragic 93.2% |
| Immigrants | Fiji | 0.0 /100 | #320 | Tragic 93.2% |
| Belizeans | 0.0 /100 | #321 | Tragic 93.1% |
| Nicaraguans | 0.0 /100 | #322 | Tragic 93.0% |
| Immigrants | Belize | 0.0 /100 | #323 | Tragic 92.9% |
| Nepalese | 0.0 /100 | #324 | Tragic 92.8% |
| Dominicans | 0.0 /100 | #325 | Tragic 92.8% |
| Central American Indians | 0.0 /100 | #326 | Tragic 92.7% |
| Immigrants | Azores | 0.0 /100 | #327 | Tragic 92.5% |
| Immigrants | Nicaragua | 0.0 /100 | #328 | Tragic 92.5% |
| Immigrants | Cabo Verde | 0.0 /100 | #329 | Tragic 92.4% |
| Immigrants | Armenia | 0.0 /100 | #330 | Tragic 92.3% |
| Hondurans | 0.0 /100 | #331 | Tragic 92.3% |
| Immigrants | Dominican Republic | 0.0 /100 | #332 | Tragic 92.3% |
| Hispanics or Latinos | 0.0 /100 | #333 | Tragic 92.2% |
Demographics Similar to Estonians by 8th Grade
In terms of 8th grade, the demographic groups most similar to Estonians are Slavic (96.8%, a difference of 0.010%), Immigrants from Scotland (96.8%, a difference of 0.010%), Celtic (96.8%, a difference of 0.020%), Bulgarian (96.9%, a difference of 0.040%), and Czechoslovakian (96.9%, a difference of 0.050%).
| Demographics | Rating | Rank | 8th Grade |
| Chinese | 100.0 /100 | #42 | Exceptional 96.9% |
| Aleuts | 99.9 /100 | #43 | Exceptional 96.9% |
| Maltese | 99.9 /100 | #44 | Exceptional 96.9% |
| Northern Europeans | 99.9 /100 | #45 | Exceptional 96.9% |
| Czechoslovakians | 99.9 /100 | #46 | Exceptional 96.9% |
| Bulgarians | 99.9 /100 | #47 | Exceptional 96.9% |
| Slavs | 99.9 /100 | #48 | Exceptional 96.8% |
| Estonians | 99.9 /100 | #49 | Exceptional 96.8% |
| Immigrants | Scotland | 99.9 /100 | #50 | Exceptional 96.8% |
| Celtics | 99.9 /100 | #51 | Exceptional 96.8% |
| Greeks | 99.9 /100 | #52 | Exceptional 96.8% |
| Austrians | 99.9 /100 | #53 | Exceptional 96.7% |
| Serbians | 99.8 /100 | #54 | Exceptional 96.7% |
| Russians | 99.8 /100 | #55 | Exceptional 96.7% |
| Australians | 99.8 /100 | #56 | Exceptional 96.7% |