Spanish American vs Immigrants from Ireland 7th Grade
COMPARE
Spanish American
Immigrants from Ireland
7th Grade
7th Grade Comparison
Spanish Americans
Immigrants from Ireland
95.7%
7TH GRADE
9.3/ 100
METRIC RATING
215th/ 347
METRIC RANK
96.8%
7TH GRADE
99.4/ 100
METRIC RATING
76th/ 347
METRIC RANK
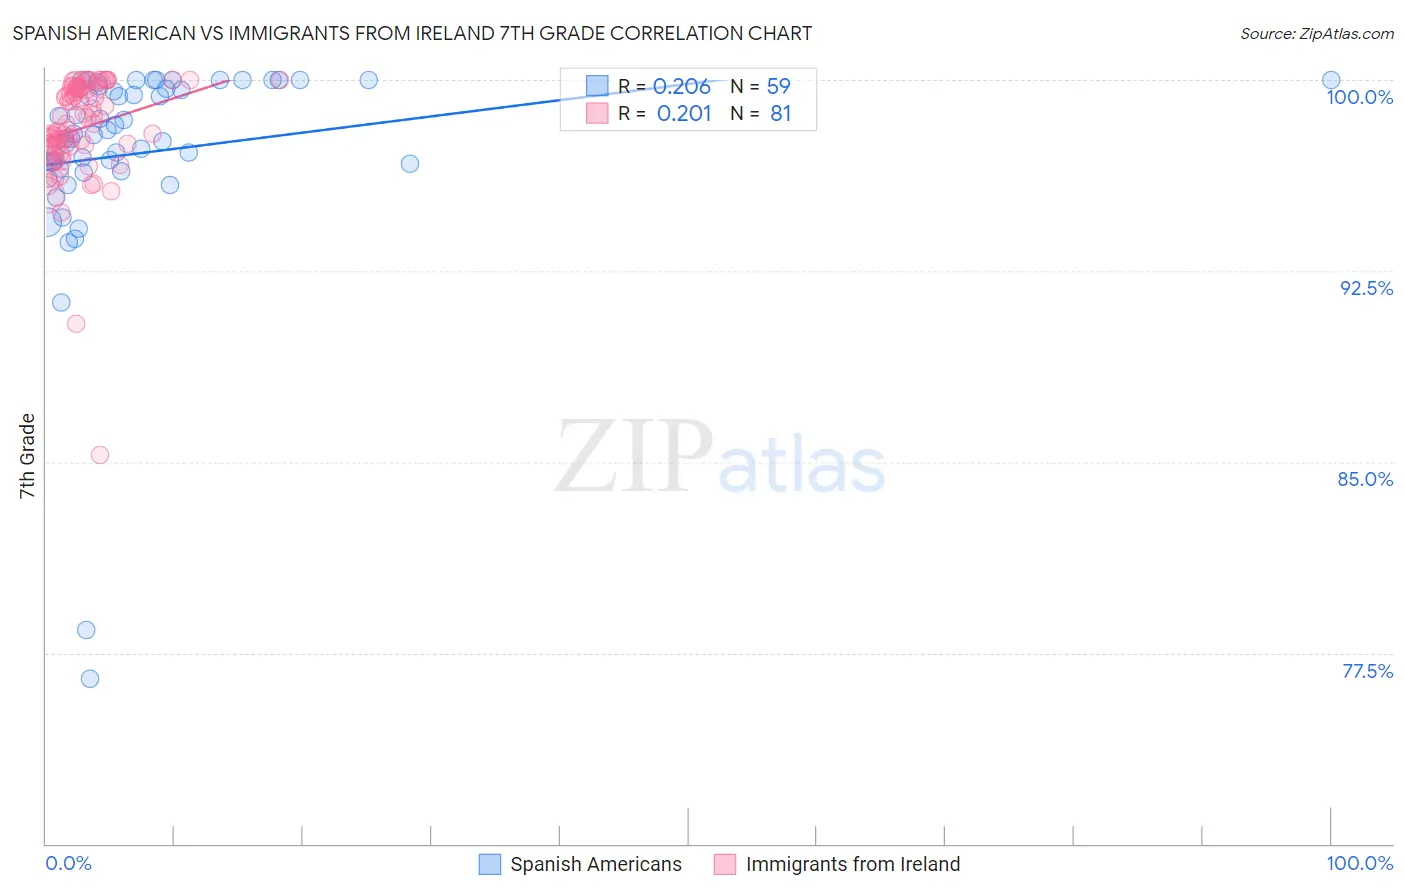
Spanish American vs Immigrants from Ireland 7th Grade Correlation Chart
The statistical analysis conducted on geographies consisting of 103,168,542 people shows a weak positive correlation between the proportion of Spanish Americans and percentage of population with at least 7th grade education in the United States with a correlation coefficient (R) of 0.206 and weighted average of 95.7%. Similarly, the statistical analysis conducted on geographies consisting of 240,784,498 people shows a weak positive correlation between the proportion of Immigrants from Ireland and percentage of population with at least 7th grade education in the United States with a correlation coefficient (R) of 0.201 and weighted average of 96.8%, a difference of 1.1%.
7th Grade Correlation Summary
| Measurement | Spanish American | Immigrants from Ireland |
| Minimum | 76.5% | 85.3% |
| Maximum | 100.0% | 100.0% |
| Range | 23.5% | 14.7% |
| Mean | 97.1% | 98.1% |
| Median | 97.8% | 98.3% |
| Interquartile 25% (IQ1) | 96.5% | 97.4% |
| Interquartile 75% (IQ3) | 99.8% | 99.7% |
| Interquartile Range (IQR) | 3.2% | 2.3% |
| Standard Deviation (Sample) | 4.2% | 2.2% |
| Standard Deviation (Population) | 4.2% | 2.2% |
Similar Demographics by 7th Grade
Demographics Similar to Spanish Americans by 7th Grade
In terms of 7th grade, the demographic groups most similar to Spanish Americans are Immigrants from Chile (95.7%, a difference of 0.0%), Immigrants from Pakistan (95.7%, a difference of 0.010%), Immigrants from Liberia (95.7%, a difference of 0.020%), Immigrants from Southern Europe (95.7%, a difference of 0.030%), and Bahamian (95.7%, a difference of 0.040%).
| Demographics | Rating | Rank | 7th Grade |
| Immigrants | Sudan | 17.0 /100 | #208 | Poor 95.8% |
| Dutch West Indians | 16.1 /100 | #209 | Poor 95.8% |
| Hawaiians | 16.0 /100 | #210 | Poor 95.8% |
| Portuguese | 13.6 /100 | #211 | Poor 95.8% |
| Immigrants | Lebanon | 13.0 /100 | #212 | Poor 95.8% |
| Immigrants | Morocco | 12.6 /100 | #213 | Poor 95.8% |
| Bahamians | 11.6 /100 | #214 | Poor 95.7% |
| Spanish Americans | 9.3 /100 | #215 | Tragic 95.7% |
| Immigrants | Chile | 9.1 /100 | #216 | Tragic 95.7% |
| Immigrants | Pakistan | 9.0 /100 | #217 | Tragic 95.7% |
| Immigrants | Liberia | 8.1 /100 | #218 | Tragic 95.7% |
| Immigrants | Southern Europe | 7.9 /100 | #219 | Tragic 95.7% |
| Sub-Saharan Africans | 7.2 /100 | #220 | Tragic 95.7% |
| Samoans | 7.0 /100 | #221 | Tragic 95.7% |
| Laotians | 6.8 /100 | #222 | Tragic 95.7% |
Demographics Similar to Immigrants from Ireland by 7th Grade
In terms of 7th grade, the demographic groups most similar to Immigrants from Ireland are Cherokee (96.8%, a difference of 0.0%), Immigrants from Netherlands (96.8%, a difference of 0.010%), Cypriot (96.8%, a difference of 0.010%), Yugoslavian (96.8%, a difference of 0.010%), and Zimbabwean (96.8%, a difference of 0.020%).
| Demographics | Rating | Rank | 7th Grade |
| Iranians | 99.6 /100 | #69 | Exceptional 96.8% |
| New Zealanders | 99.6 /100 | #70 | Exceptional 96.8% |
| Immigrants | Lithuania | 99.6 /100 | #71 | Exceptional 96.8% |
| Cajuns | 99.5 /100 | #72 | Exceptional 96.8% |
| Arapaho | 99.5 /100 | #73 | Exceptional 96.8% |
| Immigrants | England | 99.5 /100 | #74 | Exceptional 96.8% |
| Zimbabweans | 99.5 /100 | #75 | Exceptional 96.8% |
| Immigrants | Ireland | 99.4 /100 | #76 | Exceptional 96.8% |
| Cherokee | 99.4 /100 | #77 | Exceptional 96.8% |
| Immigrants | Netherlands | 99.3 /100 | #78 | Exceptional 96.8% |
| Cypriots | 99.3 /100 | #79 | Exceptional 96.8% |
| Yugoslavians | 99.3 /100 | #80 | Exceptional 96.8% |
| Delaware | 99.2 /100 | #81 | Exceptional 96.8% |
| Chickasaw | 99.2 /100 | #82 | Exceptional 96.7% |
| Icelanders | 99.1 /100 | #83 | Exceptional 96.7% |