Yuman vs Immigrants 2nd Grade
COMPARE
Yuman
Immigrants
2nd Grade
2nd Grade Comparison
Yuman
Immigrants
97.8%
2ND GRADE
20.0/ 100
METRIC RATING
203rd/ 347
METRIC RANK
97.1%
2ND GRADE
0.0/ 100
METRIC RATING
296th/ 347
METRIC RANK
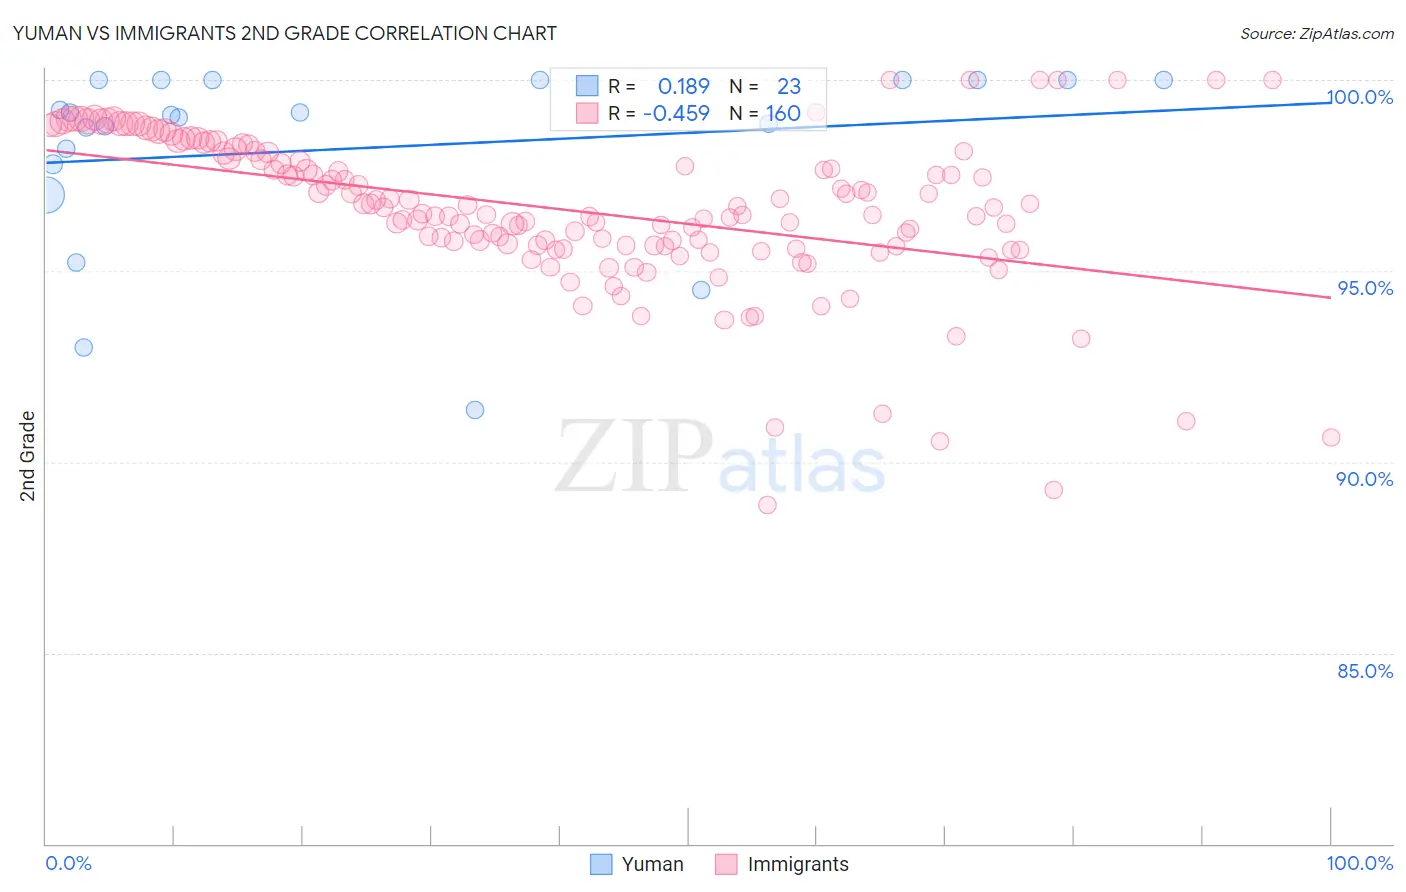
Yuman vs Immigrants 2nd Grade Correlation Chart
The statistical analysis conducted on geographies consisting of 40,696,349 people shows a poor positive correlation between the proportion of Yuman and percentage of population with at least 2nd grade education in the United States with a correlation coefficient (R) of 0.189 and weighted average of 97.8%. Similarly, the statistical analysis conducted on geographies consisting of 577,788,049 people shows a moderate negative correlation between the proportion of Immigrants and percentage of population with at least 2nd grade education in the United States with a correlation coefficient (R) of -0.459 and weighted average of 97.1%, a difference of 0.70%.
2nd Grade Correlation Summary
| Measurement | Yuman | Immigrants |
| Minimum | 91.4% | 88.9% |
| Maximum | 100.0% | 100.0% |
| Range | 8.6% | 11.1% |
| Mean | 98.2% | 96.6% |
| Median | 99.1% | 96.6% |
| Interquartile 25% (IQ1) | 97.8% | 95.7% |
| Interquartile 75% (IQ3) | 100.0% | 98.1% |
| Interquartile Range (IQR) | 2.2% | 2.5% |
| Standard Deviation (Sample) | 2.4% | 2.0% |
| Standard Deviation (Population) | 2.4% | 2.0% |
Similar Demographics by 2nd Grade
Demographics Similar to Yuman by 2nd Grade
In terms of 2nd grade, the demographic groups most similar to Yuman are Immigrants from Lebanon (97.8%, a difference of 0.0%), Tohono O'odham (97.8%, a difference of 0.0%), Immigrants from Ukraine (97.8%, a difference of 0.0%), Immigrants from Albania (97.8%, a difference of 0.010%), and Immigrants from Southern Europe (97.8%, a difference of 0.010%).
| Demographics | Rating | Rank | 2nd Grade |
| Immigrants | Kenya | 26.4 /100 | #196 | Fair 97.8% |
| Immigrants | Uganda | 26.3 /100 | #197 | Fair 97.8% |
| Guamanians/Chamorros | 25.7 /100 | #198 | Fair 97.8% |
| Immigrants | Egypt | 24.4 /100 | #199 | Fair 97.8% |
| Immigrants | Lebanon | 20.9 /100 | #200 | Fair 97.8% |
| Tohono O'odham | 20.9 /100 | #201 | Fair 97.8% |
| Immigrants | Ukraine | 20.5 /100 | #202 | Fair 97.8% |
| Yuman | 20.0 /100 | #203 | Fair 97.8% |
| Immigrants | Albania | 18.4 /100 | #204 | Poor 97.8% |
| Immigrants | Southern Europe | 18.1 /100 | #205 | Poor 97.8% |
| Immigrants | Chile | 17.3 /100 | #206 | Poor 97.7% |
| Africans | 15.6 /100 | #207 | Poor 97.7% |
| Immigrants | Northern Africa | 12.3 /100 | #208 | Poor 97.7% |
| Immigrants | Oceania | 10.9 /100 | #209 | Poor 97.7% |
| Costa Ricans | 10.5 /100 | #210 | Poor 97.7% |
Demographics Similar to Immigrants by 2nd Grade
In terms of 2nd grade, the demographic groups most similar to Immigrants are Immigrants from Grenada (97.1%, a difference of 0.040%), Malaysian (97.1%, a difference of 0.060%), Immigrants from Cuba (97.0%, a difference of 0.060%), Immigrants from Dominica (97.0%, a difference of 0.070%), and Haitian (97.0%, a difference of 0.070%).
| Demographics | Rating | Rank | 2nd Grade |
| Houma | 0.0 /100 | #289 | Tragic 97.2% |
| Immigrants | St. Vincent and the Grenadines | 0.0 /100 | #290 | Tragic 97.2% |
| Immigrants | Afghanistan | 0.0 /100 | #291 | Tragic 97.2% |
| Immigrants | Eritrea | 0.0 /100 | #292 | Tragic 97.2% |
| British West Indians | 0.0 /100 | #293 | Tragic 97.2% |
| Malaysians | 0.0 /100 | #294 | Tragic 97.1% |
| Immigrants | Grenada | 0.0 /100 | #295 | Tragic 97.1% |
| Immigrants | Immigrants | 0.0 /100 | #296 | Tragic 97.1% |
| Immigrants | Cuba | 0.0 /100 | #297 | Tragic 97.0% |
| Immigrants | Dominica | 0.0 /100 | #298 | Tragic 97.0% |
| Haitians | 0.0 /100 | #299 | Tragic 97.0% |
| Immigrants | South Eastern Asia | 0.0 /100 | #300 | Tragic 97.0% |
| Central American Indians | 0.0 /100 | #301 | Tragic 97.0% |
| Somalis | 0.0 /100 | #302 | Tragic 97.0% |
| Ecuadorians | 0.0 /100 | #303 | Tragic 96.9% |