Nepalese vs Bermudan 2nd Grade
COMPARE
Nepalese
Bermudan
2nd Grade
2nd Grade Comparison
Nepalese
Bermudans
96.1%
2ND GRADE
0.0/ 100
METRIC RATING
343rd/ 347
METRIC RANK
97.9%
2ND GRADE
59.4/ 100
METRIC RATING
163rd/ 347
METRIC RANK
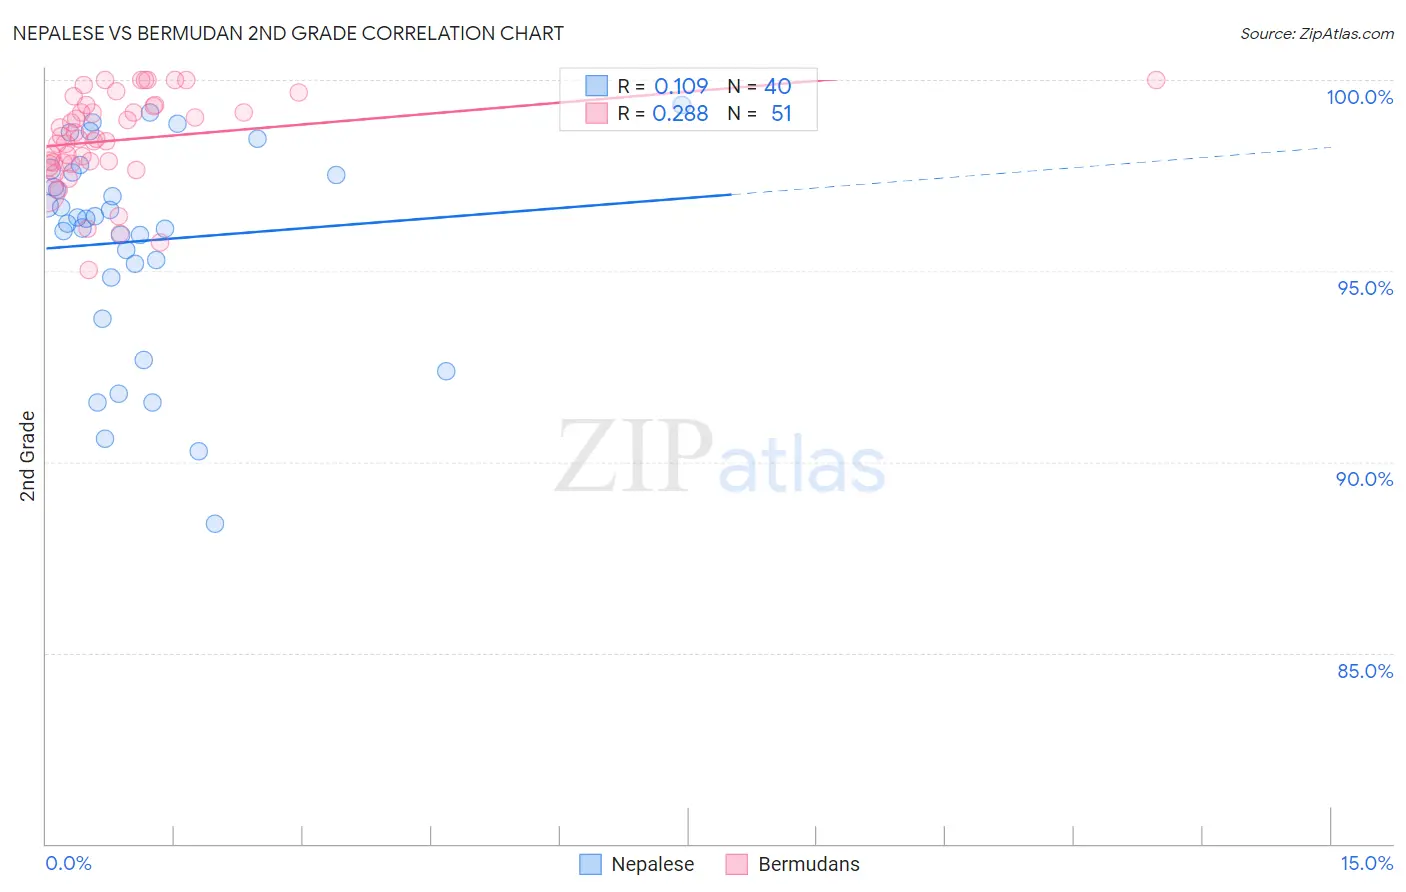
Nepalese vs Bermudan 2nd Grade Correlation Chart
The statistical analysis conducted on geographies consisting of 24,521,755 people shows a poor positive correlation between the proportion of Nepalese and percentage of population with at least 2nd grade education in the United States with a correlation coefficient (R) of 0.109 and weighted average of 96.1%. Similarly, the statistical analysis conducted on geographies consisting of 55,721,975 people shows a weak positive correlation between the proportion of Bermudans and percentage of population with at least 2nd grade education in the United States with a correlation coefficient (R) of 0.288 and weighted average of 97.9%, a difference of 1.9%.
2nd Grade Correlation Summary
| Measurement | Nepalese | Bermudan |
| Minimum | 88.4% | 95.0% |
| Maximum | 99.3% | 100.0% |
| Range | 11.0% | 5.0% |
| Mean | 95.8% | 98.4% |
| Median | 96.4% | 98.5% |
| Interquartile 25% (IQ1) | 95.0% | 97.8% |
| Interquartile 75% (IQ3) | 97.6% | 99.3% |
| Interquartile Range (IQR) | 2.6% | 1.5% |
| Standard Deviation (Sample) | 2.7% | 1.2% |
| Standard Deviation (Population) | 2.7% | 1.2% |
Similar Demographics by 2nd Grade
Demographics Similar to Nepalese by 2nd Grade
In terms of 2nd grade, the demographic groups most similar to Nepalese are Salvadoran (96.0%, a difference of 0.040%), Immigrants from Mexico (96.1%, a difference of 0.090%), Immigrants from Central America (96.2%, a difference of 0.11%), Immigrants from Guatemala (96.2%, a difference of 0.13%), and Immigrants from El Salvador (95.9%, a difference of 0.20%).
| Demographics | Rating | Rank | 2nd Grade |
| Immigrants | Dominican Republic | 0.0 /100 | #333 | Tragic 96.4% |
| Central Americans | 0.0 /100 | #334 | Tragic 96.4% |
| Yakama | 0.0 /100 | #335 | Tragic 96.4% |
| Immigrants | Fiji | 0.0 /100 | #336 | Tragic 96.4% |
| Immigrants | Cambodia | 0.0 /100 | #337 | Tragic 96.4% |
| Immigrants | Cabo Verde | 0.0 /100 | #338 | Tragic 96.3% |
| Guatemalans | 0.0 /100 | #339 | Tragic 96.3% |
| Immigrants | Guatemala | 0.0 /100 | #340 | Tragic 96.2% |
| Immigrants | Central America | 0.0 /100 | #341 | Tragic 96.2% |
| Immigrants | Mexico | 0.0 /100 | #342 | Tragic 96.1% |
| Nepalese | 0.0 /100 | #343 | Tragic 96.1% |
| Salvadorans | 0.0 /100 | #344 | Tragic 96.0% |
| Immigrants | El Salvador | 0.0 /100 | #345 | Tragic 95.9% |
| Immigrants | Yemen | 0.0 /100 | #346 | Tragic 95.7% |
| Spanish American Indians | 0.0 /100 | #347 | Tragic 95.6% |
Demographics Similar to Bermudans by 2nd Grade
In terms of 2nd grade, the demographic groups most similar to Bermudans are Immigrants from Russia (97.9%, a difference of 0.0%), Immigrants from Italy (97.9%, a difference of 0.0%), Dutch West Indian (97.9%, a difference of 0.010%), Venezuelan (97.9%, a difference of 0.010%), and Immigrants from Iran (97.9%, a difference of 0.010%).
| Demographics | Rating | Rank | 2nd Grade |
| Dutch West Indians | 63.8 /100 | #156 | Good 97.9% |
| Venezuelans | 63.3 /100 | #157 | Good 97.9% |
| Immigrants | Iran | 62.8 /100 | #158 | Good 97.9% |
| Comanche | 62.8 /100 | #159 | Good 97.9% |
| Immigrants | Eastern Europe | 61.1 /100 | #160 | Good 97.9% |
| Immigrants | Russia | 60.3 /100 | #161 | Good 97.9% |
| Immigrants | Italy | 60.2 /100 | #162 | Good 97.9% |
| Bermudans | 59.4 /100 | #163 | Average 97.9% |
| Ugandans | 56.6 /100 | #164 | Average 97.9% |
| Spanish Americans | 56.4 /100 | #165 | Average 97.9% |
| Immigrants | Jordan | 56.3 /100 | #166 | Average 97.9% |
| Chileans | 56.1 /100 | #167 | Average 97.9% |
| Brazilians | 55.8 /100 | #168 | Average 97.9% |
| Immigrants | Spain | 55.4 /100 | #169 | Average 97.9% |
| Navajo | 54.3 /100 | #170 | Average 97.9% |