Immigrants from Latin America vs Bermudan 2nd Grade
COMPARE
Immigrants from Latin America
Bermudan
2nd Grade
2nd Grade Comparison
Immigrants from Latin America
Bermudans
96.5%
2ND GRADE
0.0/ 100
METRIC RATING
330th/ 347
METRIC RANK
97.9%
2ND GRADE
59.4/ 100
METRIC RATING
163rd/ 347
METRIC RANK
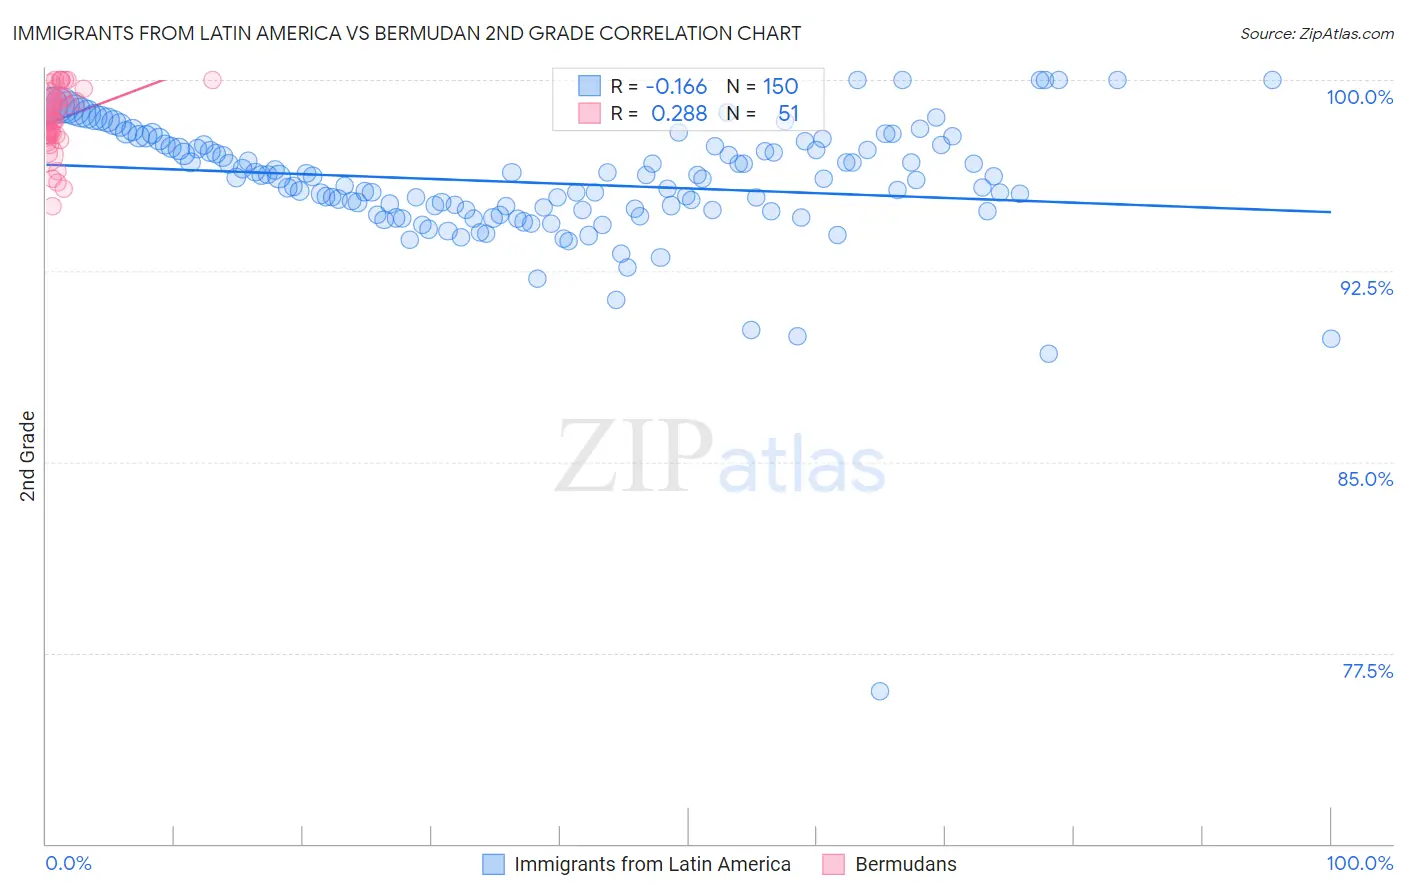
Immigrants from Latin America vs Bermudan 2nd Grade Correlation Chart
The statistical analysis conducted on geographies consisting of 558,651,896 people shows a poor negative correlation between the proportion of Immigrants from Latin America and percentage of population with at least 2nd grade education in the United States with a correlation coefficient (R) of -0.166 and weighted average of 96.5%. Similarly, the statistical analysis conducted on geographies consisting of 55,721,975 people shows a weak positive correlation between the proportion of Bermudans and percentage of population with at least 2nd grade education in the United States with a correlation coefficient (R) of 0.288 and weighted average of 97.9%, a difference of 1.4%.
2nd Grade Correlation Summary
| Measurement | Immigrants from Latin America | Bermudan |
| Minimum | 76.0% | 95.0% |
| Maximum | 100.0% | 100.0% |
| Range | 24.0% | 5.0% |
| Mean | 96.0% | 98.4% |
| Median | 96.2% | 98.5% |
| Interquartile 25% (IQ1) | 94.9% | 97.8% |
| Interquartile 75% (IQ3) | 97.4% | 99.3% |
| Interquartile Range (IQR) | 2.6% | 1.5% |
| Standard Deviation (Sample) | 2.6% | 1.2% |
| Standard Deviation (Population) | 2.6% | 1.2% |
Similar Demographics by 2nd Grade
Demographics Similar to Immigrants from Latin America by 2nd Grade
In terms of 2nd grade, the demographic groups most similar to Immigrants from Latin America are Immigrants from Vietnam (96.5%, a difference of 0.010%), Mexican (96.5%, a difference of 0.010%), Japanese (96.5%, a difference of 0.010%), Immigrants from Armenia (96.5%, a difference of 0.040%), and Bangladeshi (96.5%, a difference of 0.050%).
| Demographics | Rating | Rank | 2nd Grade |
| Vietnamese | 0.0 /100 | #323 | Tragic 96.7% |
| Mexican American Indians | 0.0 /100 | #324 | Tragic 96.7% |
| Dominicans | 0.0 /100 | #325 | Tragic 96.6% |
| Immigrants | Honduras | 0.0 /100 | #326 | Tragic 96.6% |
| Immigrants | Vietnam | 0.0 /100 | #327 | Tragic 96.5% |
| Mexicans | 0.0 /100 | #328 | Tragic 96.5% |
| Japanese | 0.0 /100 | #329 | Tragic 96.5% |
| Immigrants | Latin America | 0.0 /100 | #330 | Tragic 96.5% |
| Immigrants | Armenia | 0.0 /100 | #331 | Tragic 96.5% |
| Bangladeshis | 0.0 /100 | #332 | Tragic 96.5% |
| Immigrants | Dominican Republic | 0.0 /100 | #333 | Tragic 96.4% |
| Central Americans | 0.0 /100 | #334 | Tragic 96.4% |
| Yakama | 0.0 /100 | #335 | Tragic 96.4% |
| Immigrants | Fiji | 0.0 /100 | #336 | Tragic 96.4% |
| Immigrants | Cambodia | 0.0 /100 | #337 | Tragic 96.4% |
Demographics Similar to Bermudans by 2nd Grade
In terms of 2nd grade, the demographic groups most similar to Bermudans are Immigrants from Russia (97.9%, a difference of 0.0%), Immigrants from Italy (97.9%, a difference of 0.0%), Dutch West Indian (97.9%, a difference of 0.010%), Venezuelan (97.9%, a difference of 0.010%), and Immigrants from Iran (97.9%, a difference of 0.010%).
| Demographics | Rating | Rank | 2nd Grade |
| Dutch West Indians | 63.8 /100 | #156 | Good 97.9% |
| Venezuelans | 63.3 /100 | #157 | Good 97.9% |
| Immigrants | Iran | 62.8 /100 | #158 | Good 97.9% |
| Comanche | 62.8 /100 | #159 | Good 97.9% |
| Immigrants | Eastern Europe | 61.1 /100 | #160 | Good 97.9% |
| Immigrants | Russia | 60.3 /100 | #161 | Good 97.9% |
| Immigrants | Italy | 60.2 /100 | #162 | Good 97.9% |
| Bermudans | 59.4 /100 | #163 | Average 97.9% |
| Ugandans | 56.6 /100 | #164 | Average 97.9% |
| Spanish Americans | 56.4 /100 | #165 | Average 97.9% |
| Immigrants | Jordan | 56.3 /100 | #166 | Average 97.9% |
| Chileans | 56.1 /100 | #167 | Average 97.9% |
| Brazilians | 55.8 /100 | #168 | Average 97.9% |
| Immigrants | Spain | 55.4 /100 | #169 | Average 97.9% |
| Navajo | 54.3 /100 | #170 | Average 97.9% |