Immigrants from Kuwait vs Immigrants from Malaysia 11th Grade
COMPARE
Immigrants from Kuwait
Immigrants from Malaysia
11th Grade
11th Grade Comparison
Immigrants from Kuwait
Immigrants from Malaysia
93.5%
11TH GRADE
98.4/ 100
METRIC RATING
109th/ 347
METRIC RANK
92.4%
11TH GRADE
37.6/ 100
METRIC RATING
183rd/ 347
METRIC RANK
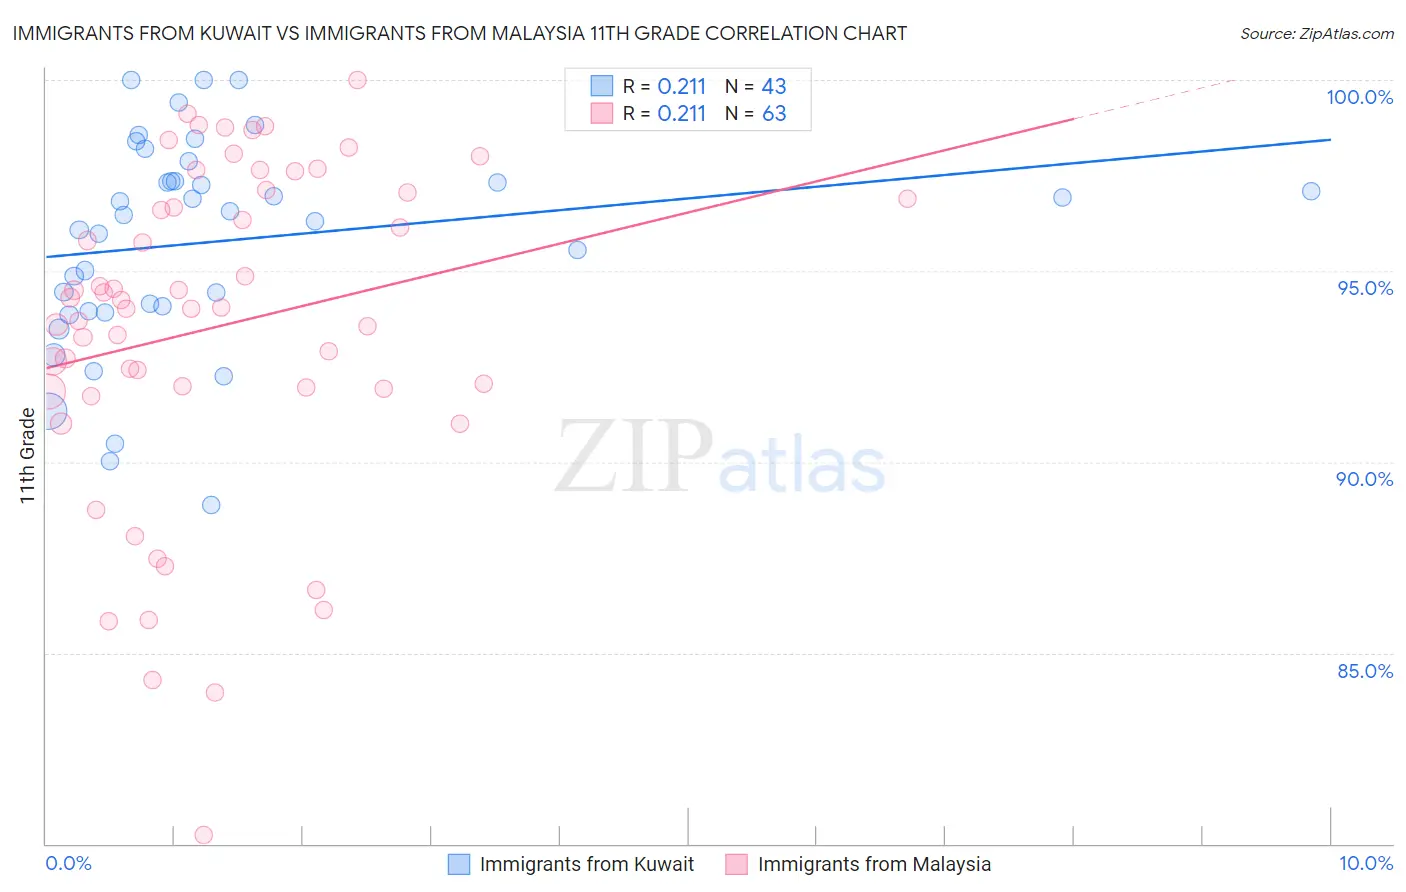
Immigrants from Kuwait vs Immigrants from Malaysia 11th Grade Correlation Chart
The statistical analysis conducted on geographies consisting of 136,917,085 people shows a weak positive correlation between the proportion of Immigrants from Kuwait and percentage of population with at least 11th grade education in the United States with a correlation coefficient (R) of 0.211 and weighted average of 93.5%. Similarly, the statistical analysis conducted on geographies consisting of 197,973,709 people shows a weak positive correlation between the proportion of Immigrants from Malaysia and percentage of population with at least 11th grade education in the United States with a correlation coefficient (R) of 0.211 and weighted average of 92.4%, a difference of 1.1%.
11th Grade Correlation Summary
| Measurement | Immigrants from Kuwait | Immigrants from Malaysia |
| Minimum | 88.9% | 80.2% |
| Maximum | 100.0% | 100.0% |
| Range | 11.1% | 19.8% |
| Mean | 95.8% | 93.5% |
| Median | 96.5% | 94.0% |
| Interquartile 25% (IQ1) | 94.0% | 91.9% |
| Interquartile 75% (IQ3) | 97.4% | 97.0% |
| Interquartile Range (IQR) | 3.4% | 5.1% |
| Standard Deviation (Sample) | 2.7% | 4.3% |
| Standard Deviation (Population) | 2.7% | 4.3% |
Similar Demographics by 11th Grade
Demographics Similar to Immigrants from Kuwait by 11th Grade
In terms of 11th grade, the demographic groups most similar to Immigrants from Kuwait are Alaska Native (93.5%, a difference of 0.0%), Immigrants from Norway (93.5%, a difference of 0.010%), Syrian (93.4%, a difference of 0.010%), Chippewa (93.5%, a difference of 0.030%), and Lebanese (93.5%, a difference of 0.030%).
| Demographics | Rating | Rank | 11th Grade |
| Chippewa | 98.6 /100 | #102 | Exceptional 93.5% |
| Lebanese | 98.6 /100 | #103 | Exceptional 93.5% |
| Immigrants | Europe | 98.6 /100 | #104 | Exceptional 93.5% |
| Immigrants | Serbia | 98.6 /100 | #105 | Exceptional 93.5% |
| Immigrants | Croatia | 98.6 /100 | #106 | Exceptional 93.5% |
| Immigrants | Norway | 98.4 /100 | #107 | Exceptional 93.5% |
| Alaska Natives | 98.4 /100 | #108 | Exceptional 93.5% |
| Immigrants | Kuwait | 98.4 /100 | #109 | Exceptional 93.5% |
| Syrians | 98.4 /100 | #110 | Exceptional 93.4% |
| Yugoslavians | 98.1 /100 | #111 | Exceptional 93.4% |
| Immigrants | Germany | 98.0 /100 | #112 | Exceptional 93.4% |
| Immigrants | Zimbabwe | 97.8 /100 | #113 | Exceptional 93.4% |
| Jordanians | 97.8 /100 | #114 | Exceptional 93.4% |
| Palestinians | 97.7 /100 | #115 | Exceptional 93.4% |
| Immigrants | Hungary | 97.5 /100 | #116 | Exceptional 93.4% |
Demographics Similar to Immigrants from Malaysia by 11th Grade
In terms of 11th grade, the demographic groups most similar to Immigrants from Malaysia are Immigrants from Asia (92.4%, a difference of 0.0%), Immigrants from Morocco (92.4%, a difference of 0.010%), Immigrants from Nepal (92.4%, a difference of 0.010%), Creek (92.4%, a difference of 0.030%), and Inupiat (92.4%, a difference of 0.030%).
| Demographics | Rating | Rank | 11th Grade |
| Spaniards | 46.9 /100 | #176 | Average 92.5% |
| Guamanians/Chamorros | 45.0 /100 | #177 | Average 92.5% |
| Sudanese | 43.4 /100 | #178 | Average 92.5% |
| Creek | 40.9 /100 | #179 | Average 92.4% |
| Inupiat | 40.7 /100 | #180 | Average 92.4% |
| Cherokee | 40.7 /100 | #181 | Average 92.4% |
| Immigrants | Morocco | 38.6 /100 | #182 | Fair 92.4% |
| Immigrants | Malaysia | 37.6 /100 | #183 | Fair 92.4% |
| Immigrants | Asia | 37.4 /100 | #184 | Fair 92.4% |
| Immigrants | Nepal | 36.4 /100 | #185 | Fair 92.4% |
| Arapaho | 35.1 /100 | #186 | Fair 92.4% |
| Immigrants | Western Asia | 35.0 /100 | #187 | Fair 92.4% |
| Immigrants | Indonesia | 33.7 /100 | #188 | Fair 92.4% |
| Immigrants | Chile | 33.3 /100 | #189 | Fair 92.4% |
| Chickasaw | 31.4 /100 | #190 | Fair 92.3% |