Yugoslavian vs Bhutanese 4th Grade
COMPARE
Yugoslavian
Bhutanese
4th Grade
4th Grade Comparison
Yugoslavians
Bhutanese
97.9%
4TH GRADE
98.1/ 100
METRIC RATING
100th/ 347
METRIC RANK
97.9%
4TH GRADE
97.4/ 100
METRIC RATING
107th/ 347
METRIC RANK
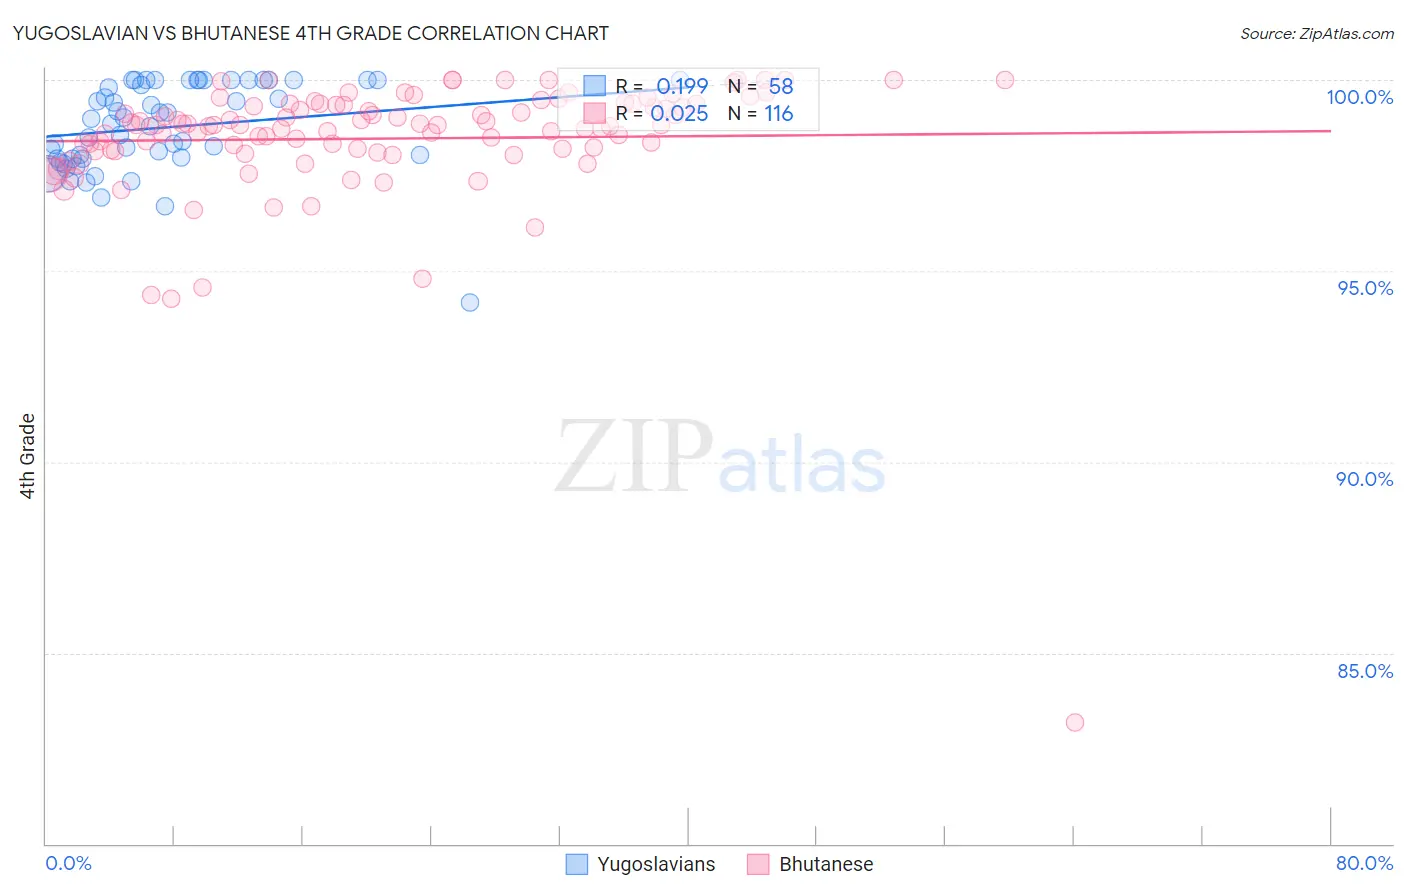
Yugoslavian vs Bhutanese 4th Grade Correlation Chart
The statistical analysis conducted on geographies consisting of 285,618,157 people shows a poor positive correlation between the proportion of Yugoslavians and percentage of population with at least 4th grade education in the United States with a correlation coefficient (R) of 0.199 and weighted average of 97.9%. Similarly, the statistical analysis conducted on geographies consisting of 455,591,134 people shows no correlation between the proportion of Bhutanese and percentage of population with at least 4th grade education in the United States with a correlation coefficient (R) of 0.025 and weighted average of 97.9%, a difference of 0.030%.
4th Grade Correlation Summary
| Measurement | Yugoslavian | Bhutanese |
| Minimum | 94.2% | 83.2% |
| Maximum | 100.0% | 100.0% |
| Range | 5.8% | 16.8% |
| Mean | 98.8% | 98.5% |
| Median | 98.9% | 98.8% |
| Interquartile 25% (IQ1) | 97.9% | 98.2% |
| Interquartile 75% (IQ3) | 100.0% | 99.4% |
| Interquartile Range (IQR) | 2.1% | 1.2% |
| Standard Deviation (Sample) | 1.2% | 1.8% |
| Standard Deviation (Population) | 1.2% | 1.8% |
Demographics Similar to Yugoslavians and Bhutanese by 4th Grade
In terms of 4th grade, the demographic groups most similar to Yugoslavians are Turkish (97.9%, a difference of 0.0%), Cree (97.9%, a difference of 0.0%), Cheyenne (97.9%, a difference of 0.010%), South African (97.9%, a difference of 0.010%), and Choctaw (97.9%, a difference of 0.010%). Similarly, the demographic groups most similar to Bhutanese are Immigrants from Czechoslovakia (97.9%, a difference of 0.0%), Immigrants from Singapore (97.9%, a difference of 0.0%), Puget Sound Salish (97.9%, a difference of 0.010%), Nonimmigrants (97.9%, a difference of 0.010%), and German Russian (97.9%, a difference of 0.010%).
| Demographics | Rating | Rank | 4th Grade |
| Immigrants | Ireland | 98.7 /100 | #93 | Exceptional 97.9% |
| Shoshone | 98.7 /100 | #94 | Exceptional 97.9% |
| Immigrants | Germany | 98.5 /100 | #95 | Exceptional 97.9% |
| Romanians | 98.4 /100 | #96 | Exceptional 97.9% |
| Cheyenne | 98.4 /100 | #97 | Exceptional 97.9% |
| South Africans | 98.2 /100 | #98 | Exceptional 97.9% |
| Turks | 98.2 /100 | #99 | Exceptional 97.9% |
| Yugoslavians | 98.1 /100 | #100 | Exceptional 97.9% |
| Cree | 98.1 /100 | #101 | Exceptional 97.9% |
| Choctaw | 97.9 /100 | #102 | Exceptional 97.9% |
| Puget Sound Salish | 97.7 /100 | #103 | Exceptional 97.9% |
| Immigrants | Nonimmigrants | 97.5 /100 | #104 | Exceptional 97.9% |
| German Russians | 97.5 /100 | #105 | Exceptional 97.9% |
| Immigrants | Czechoslovakia | 97.5 /100 | #106 | Exceptional 97.9% |
| Bhutanese | 97.4 /100 | #107 | Exceptional 97.9% |
| Immigrants | Singapore | 97.3 /100 | #108 | Exceptional 97.9% |
| Immigrants | Latvia | 96.8 /100 | #109 | Exceptional 97.8% |
| Thais | 96.7 /100 | #110 | Exceptional 97.8% |
| Immigrants | Switzerland | 96.1 /100 | #111 | Exceptional 97.8% |
| Okinawans | 96.0 /100 | #112 | Exceptional 97.8% |
| Basques | 95.8 /100 | #113 | Exceptional 97.8% |