Yugoslavian vs Immigrants from Costa Rica 7th Grade
COMPARE
Yugoslavian
Immigrants from Costa Rica
7th Grade
7th Grade Comparison
Yugoslavians
Immigrants from Costa Rica
96.8%
7TH GRADE
99.3/ 100
METRIC RATING
80th/ 347
METRIC RANK
95.3%
7TH GRADE
0.6/ 100
METRIC RATING
259th/ 347
METRIC RANK
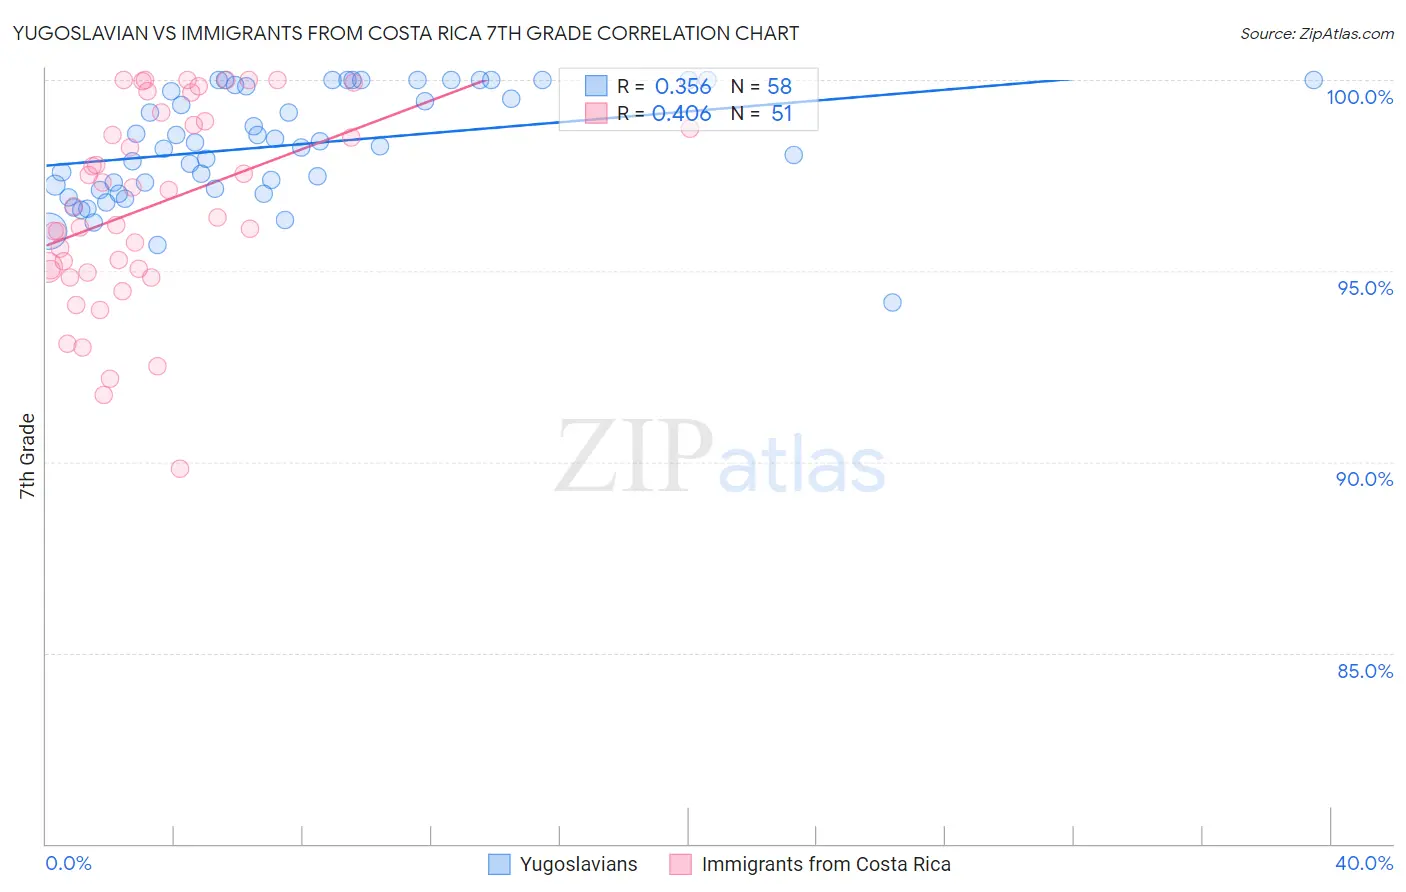
Yugoslavian vs Immigrants from Costa Rica 7th Grade Correlation Chart
The statistical analysis conducted on geographies consisting of 285,618,157 people shows a mild positive correlation between the proportion of Yugoslavians and percentage of population with at least 7th grade education in the United States with a correlation coefficient (R) of 0.356 and weighted average of 96.8%. Similarly, the statistical analysis conducted on geographies consisting of 204,272,182 people shows a moderate positive correlation between the proportion of Immigrants from Costa Rica and percentage of population with at least 7th grade education in the United States with a correlation coefficient (R) of 0.406 and weighted average of 95.3%, a difference of 1.6%.
7th Grade Correlation Summary
| Measurement | Yugoslavian | Immigrants from Costa Rica |
| Minimum | 94.2% | 89.8% |
| Maximum | 100.0% | 100.0% |
| Range | 5.8% | 10.2% |
| Mean | 98.3% | 96.7% |
| Median | 98.3% | 96.7% |
| Interquartile 25% (IQ1) | 97.1% | 95.0% |
| Interquartile 75% (IQ3) | 99.9% | 98.9% |
| Interquartile Range (IQR) | 2.7% | 3.9% |
| Standard Deviation (Sample) | 1.4% | 2.6% |
| Standard Deviation (Population) | 1.4% | 2.5% |
Similar Demographics by 7th Grade
Demographics Similar to Yugoslavians by 7th Grade
In terms of 7th grade, the demographic groups most similar to Yugoslavians are Immigrants from Netherlands (96.8%, a difference of 0.0%), Cypriot (96.8%, a difference of 0.0%), Immigrants from Ireland (96.8%, a difference of 0.010%), Cherokee (96.8%, a difference of 0.010%), and Delaware (96.8%, a difference of 0.020%).
| Demographics | Rating | Rank | 7th Grade |
| Arapaho | 99.5 /100 | #73 | Exceptional 96.8% |
| Immigrants | England | 99.5 /100 | #74 | Exceptional 96.8% |
| Zimbabweans | 99.5 /100 | #75 | Exceptional 96.8% |
| Immigrants | Ireland | 99.4 /100 | #76 | Exceptional 96.8% |
| Cherokee | 99.4 /100 | #77 | Exceptional 96.8% |
| Immigrants | Netherlands | 99.3 /100 | #78 | Exceptional 96.8% |
| Cypriots | 99.3 /100 | #79 | Exceptional 96.8% |
| Yugoslavians | 99.3 /100 | #80 | Exceptional 96.8% |
| Delaware | 99.2 /100 | #81 | Exceptional 96.8% |
| Chickasaw | 99.2 /100 | #82 | Exceptional 96.7% |
| Icelanders | 99.1 /100 | #83 | Exceptional 96.7% |
| Romanians | 99.1 /100 | #84 | Exceptional 96.7% |
| Kiowa | 99.1 /100 | #85 | Exceptional 96.7% |
| Turks | 99.1 /100 | #86 | Exceptional 96.7% |
| Immigrants | Belgium | 99.0 /100 | #87 | Exceptional 96.7% |
Demographics Similar to Immigrants from Costa Rica by 7th Grade
In terms of 7th grade, the demographic groups most similar to Immigrants from Costa Rica are Immigrants from China (95.3%, a difference of 0.030%), Immigrants from Congo (95.3%, a difference of 0.030%), Ghanaian (95.3%, a difference of 0.030%), Afghan (95.3%, a difference of 0.030%), and Korean (95.3%, a difference of 0.040%).
| Demographics | Rating | Rank | 7th Grade |
| Immigrants | Ethiopia | 0.9 /100 | #252 | Tragic 95.3% |
| Somalis | 0.9 /100 | #253 | Tragic 95.3% |
| Colombians | 0.8 /100 | #254 | Tragic 95.3% |
| Koreans | 0.8 /100 | #255 | Tragic 95.3% |
| Immigrants | China | 0.7 /100 | #256 | Tragic 95.3% |
| Immigrants | Congo | 0.7 /100 | #257 | Tragic 95.3% |
| Ghanaians | 0.7 /100 | #258 | Tragic 95.3% |
| Immigrants | Costa Rica | 0.6 /100 | #259 | Tragic 95.3% |
| Afghans | 0.5 /100 | #260 | Tragic 95.3% |
| South Americans | 0.5 /100 | #261 | Tragic 95.2% |
| Immigrants | Somalia | 0.5 /100 | #262 | Tragic 95.2% |
| West Indians | 0.5 /100 | #263 | Tragic 95.2% |
| Immigrants | Nigeria | 0.4 /100 | #264 | Tragic 95.2% |
| Immigrants | Uruguay | 0.3 /100 | #265 | Tragic 95.2% |
| Immigrants | Ghana | 0.3 /100 | #266 | Tragic 95.2% |