Korean vs Immigrants from Costa Rica 7th Grade
COMPARE
Korean
Immigrants from Costa Rica
7th Grade
7th Grade Comparison
Koreans
Immigrants from Costa Rica
95.3%
7TH GRADE
0.8/ 100
METRIC RATING
255th/ 347
METRIC RANK
95.3%
7TH GRADE
0.6/ 100
METRIC RATING
259th/ 347
METRIC RANK
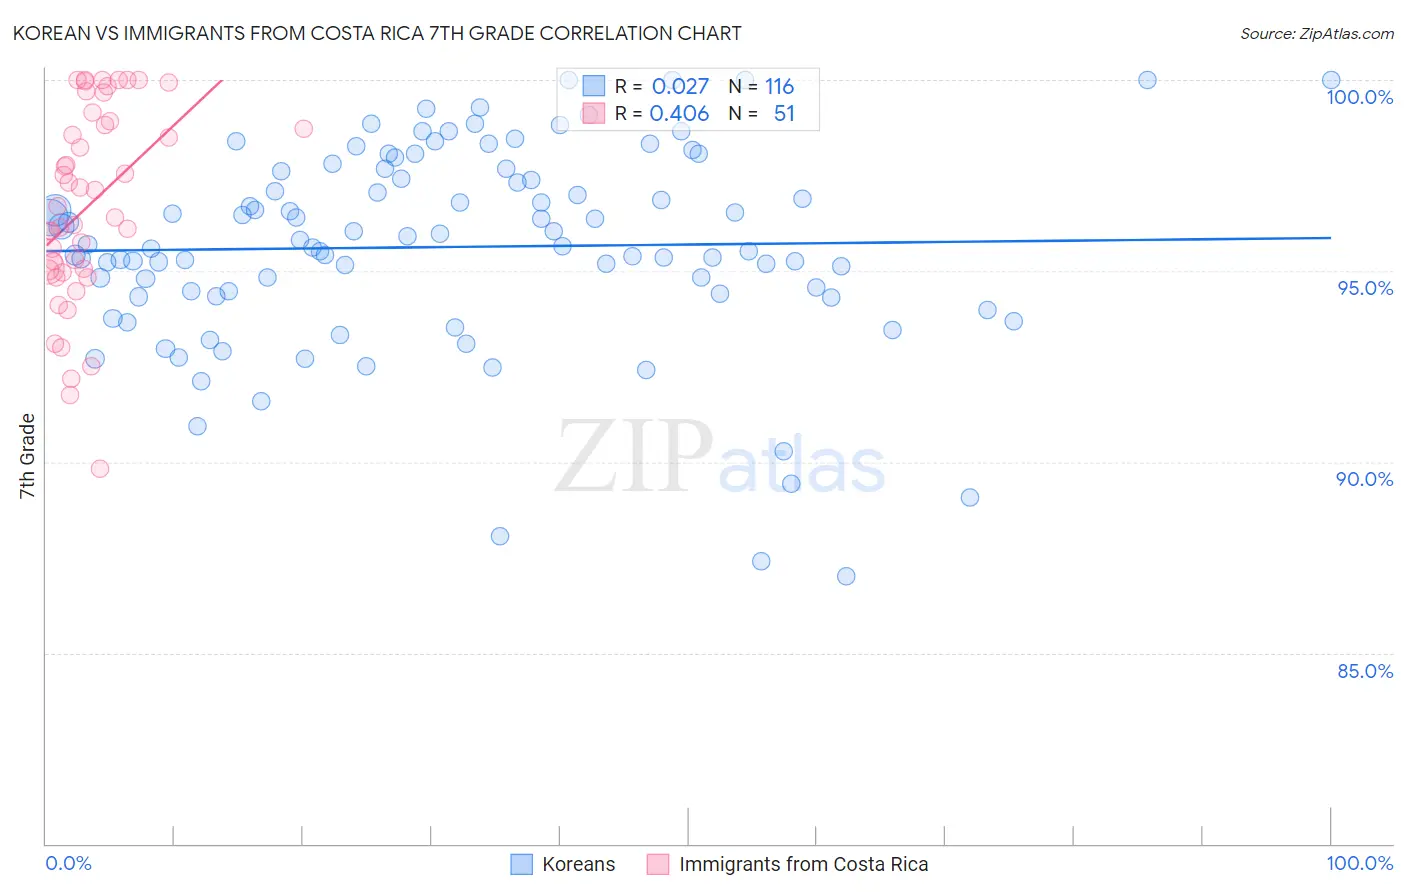
Korean vs Immigrants from Costa Rica 7th Grade Correlation Chart
The statistical analysis conducted on geographies consisting of 510,944,198 people shows no correlation between the proportion of Koreans and percentage of population with at least 7th grade education in the United States with a correlation coefficient (R) of 0.027 and weighted average of 95.3%. Similarly, the statistical analysis conducted on geographies consisting of 204,272,182 people shows a moderate positive correlation between the proportion of Immigrants from Costa Rica and percentage of population with at least 7th grade education in the United States with a correlation coefficient (R) of 0.406 and weighted average of 95.3%, a difference of 0.040%.
7th Grade Correlation Summary
| Measurement | Korean | Immigrants from Costa Rica |
| Minimum | 87.0% | 89.8% |
| Maximum | 100.0% | 100.0% |
| Range | 13.0% | 10.2% |
| Mean | 95.6% | 96.7% |
| Median | 95.7% | 96.7% |
| Interquartile 25% (IQ1) | 94.4% | 95.0% |
| Interquartile 75% (IQ3) | 97.5% | 98.9% |
| Interquartile Range (IQR) | 3.1% | 3.9% |
| Standard Deviation (Sample) | 2.6% | 2.6% |
| Standard Deviation (Population) | 2.6% | 2.5% |
Demographics Similar to Koreans and Immigrants from Costa Rica by 7th Grade
In terms of 7th grade, the demographic groups most similar to Koreans are Colombian (95.3%, a difference of 0.010%), Immigrants from China (95.3%, a difference of 0.010%), Immigrants from Congo (95.3%, a difference of 0.010%), Ghanaian (95.3%, a difference of 0.010%), and Somali (95.3%, a difference of 0.020%). Similarly, the demographic groups most similar to Immigrants from Costa Rica are Immigrants from China (95.3%, a difference of 0.030%), Immigrants from Congo (95.3%, a difference of 0.030%), Ghanaian (95.3%, a difference of 0.030%), Afghan (95.3%, a difference of 0.030%), and South American (95.2%, a difference of 0.040%).
| Demographics | Rating | Rank | 7th Grade |
| Tongans | 1.3 /100 | #247 | Tragic 95.4% |
| Paiute | 1.2 /100 | #248 | Tragic 95.4% |
| Bolivians | 1.1 /100 | #249 | Tragic 95.4% |
| Immigrants | Cameroon | 0.9 /100 | #250 | Tragic 95.4% |
| Immigrants | Jamaica | 0.9 /100 | #251 | Tragic 95.4% |
| Immigrants | Ethiopia | 0.9 /100 | #252 | Tragic 95.3% |
| Somalis | 0.9 /100 | #253 | Tragic 95.3% |
| Colombians | 0.8 /100 | #254 | Tragic 95.3% |
| Koreans | 0.8 /100 | #255 | Tragic 95.3% |
| Immigrants | China | 0.7 /100 | #256 | Tragic 95.3% |
| Immigrants | Congo | 0.7 /100 | #257 | Tragic 95.3% |
| Ghanaians | 0.7 /100 | #258 | Tragic 95.3% |
| Immigrants | Costa Rica | 0.6 /100 | #259 | Tragic 95.3% |
| Afghans | 0.5 /100 | #260 | Tragic 95.3% |
| South Americans | 0.5 /100 | #261 | Tragic 95.2% |
| Immigrants | Somalia | 0.5 /100 | #262 | Tragic 95.2% |
| West Indians | 0.5 /100 | #263 | Tragic 95.2% |
| Immigrants | Nigeria | 0.4 /100 | #264 | Tragic 95.2% |
| Immigrants | Uruguay | 0.3 /100 | #265 | Tragic 95.2% |
| Immigrants | Ghana | 0.3 /100 | #266 | Tragic 95.2% |
| Yuman | 0.3 /100 | #267 | Tragic 95.2% |