Immigrants from Singapore vs Immigrants from Argentina Nursery School
COMPARE
Immigrants from Singapore
Immigrants from Argentina
Nursery School
Nursery School Comparison
Immigrants from Singapore
Immigrants from Argentina
98.2%
NURSERY SCHOOL
96.9/ 100
METRIC RATING
110th/ 347
METRIC RANK
98.0%
NURSERY SCHOOL
40.8/ 100
METRIC RATING
186th/ 347
METRIC RANK
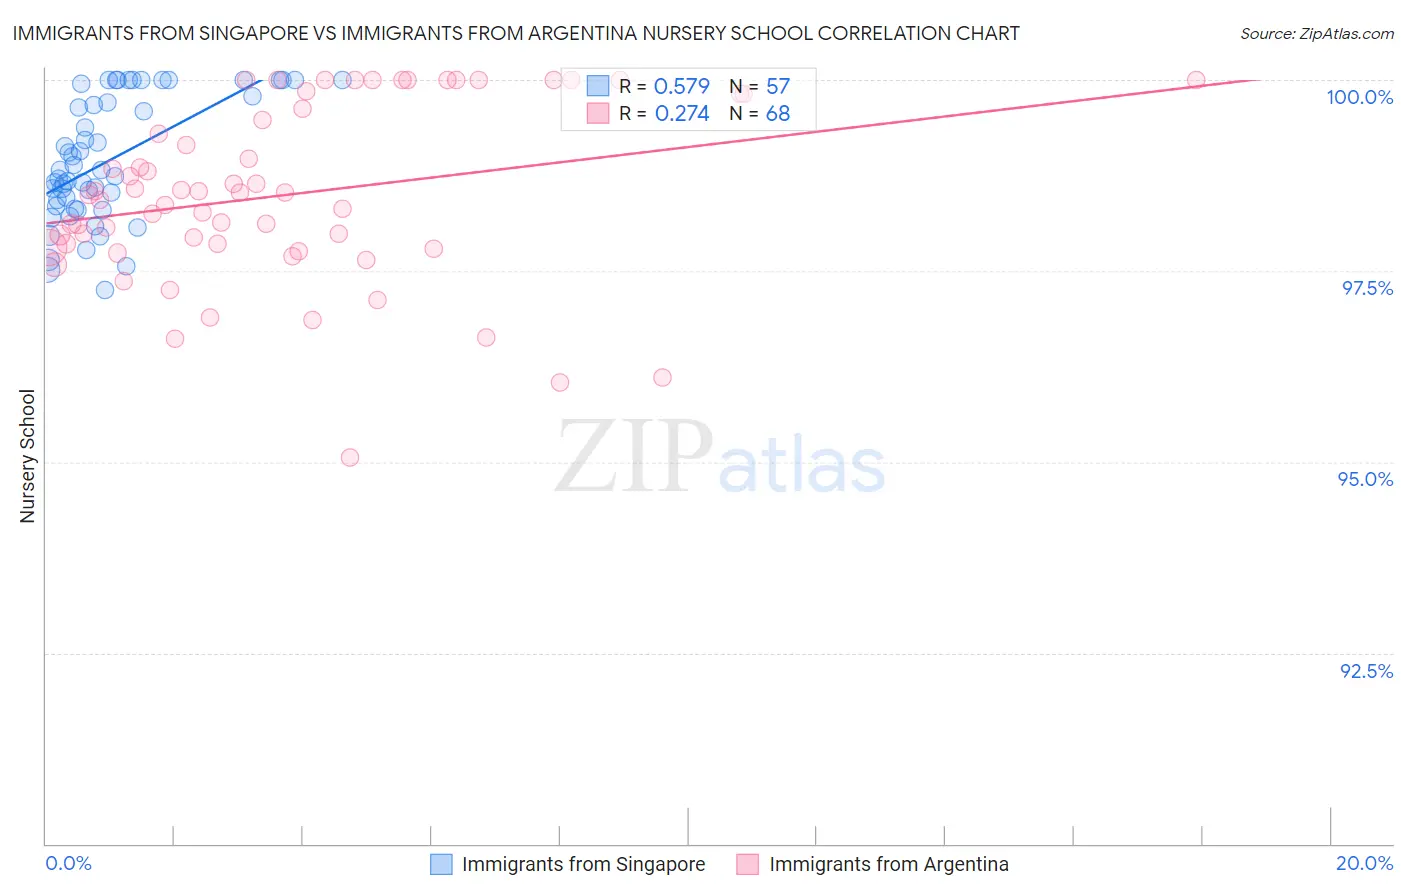
Immigrants from Singapore vs Immigrants from Argentina Nursery School Correlation Chart
The statistical analysis conducted on geographies consisting of 137,521,700 people shows a substantial positive correlation between the proportion of Immigrants from Singapore and percentage of population with at least nursery school education in the United States with a correlation coefficient (R) of 0.579 and weighted average of 98.2%. Similarly, the statistical analysis conducted on geographies consisting of 264,435,492 people shows a weak positive correlation between the proportion of Immigrants from Argentina and percentage of population with at least nursery school education in the United States with a correlation coefficient (R) of 0.274 and weighted average of 98.0%, a difference of 0.29%.
Nursery School Correlation Summary
| Measurement | Immigrants from Singapore | Immigrants from Argentina |
| Minimum | 97.2% | 95.1% |
| Maximum | 100.0% | 100.0% |
| Range | 2.8% | 4.9% |
| Mean | 99.0% | 98.5% |
| Median | 98.8% | 98.5% |
| Interquartile 25% (IQ1) | 98.3% | 97.8% |
| Interquartile 75% (IQ3) | 99.9% | 99.7% |
| Interquartile Range (IQR) | 1.5% | 1.9% |
| Standard Deviation (Sample) | 0.80% | 1.2% |
| Standard Deviation (Population) | 0.80% | 1.1% |
Similar Demographics by Nursery School
Demographics Similar to Immigrants from Singapore by Nursery School
In terms of nursery school, the demographic groups most similar to Immigrants from Singapore are Immigrants from Czechoslovakia (98.2%, a difference of 0.0%), Bhutanese (98.2%, a difference of 0.010%), Turkish (98.2%, a difference of 0.010%), Immigrants from Switzerland (98.2%, a difference of 0.010%), and Basque (98.2%, a difference of 0.010%).
| Demographics | Rating | Rank | Nursery School |
| Cree | 97.7 /100 | #103 | Exceptional 98.3% |
| Bhutanese | 97.4 /100 | #104 | Exceptional 98.2% |
| Turks | 97.4 /100 | #105 | Exceptional 98.2% |
| Immigrants | Switzerland | 97.3 /100 | #106 | Exceptional 98.2% |
| Basques | 97.3 /100 | #107 | Exceptional 98.2% |
| Pima | 97.1 /100 | #108 | Exceptional 98.2% |
| German Russians | 97.1 /100 | #109 | Exceptional 98.2% |
| Immigrants | Singapore | 96.9 /100 | #110 | Exceptional 98.2% |
| Immigrants | Czechoslovakia | 96.8 /100 | #111 | Exceptional 98.2% |
| Immigrants | Norway | 96.6 /100 | #112 | Exceptional 98.2% |
| Immigrants | Latvia | 96.4 /100 | #113 | Exceptional 98.2% |
| Ute | 96.4 /100 | #114 | Exceptional 98.2% |
| Iranians | 96.3 /100 | #115 | Exceptional 98.2% |
| Spanish | 95.8 /100 | #116 | Exceptional 98.2% |
| Immigrants | France | 95.6 /100 | #117 | Exceptional 98.2% |
Demographics Similar to Immigrants from Argentina by Nursery School
In terms of nursery school, the demographic groups most similar to Immigrants from Argentina are Paiute (98.0%, a difference of 0.0%), Portuguese (98.0%, a difference of 0.0%), Immigrants from Poland (98.0%, a difference of 0.0%), Immigrants from Belarus (98.0%, a difference of 0.0%), and Immigrants from Bosnia and Herzegovina (98.0%, a difference of 0.010%).
| Demographics | Rating | Rank | Nursery School |
| Argentineans | 46.8 /100 | #179 | Average 98.0% |
| Immigrants | Bosnia and Herzegovina | 45.6 /100 | #180 | Average 98.0% |
| Egyptians | 42.8 /100 | #181 | Average 98.0% |
| Paiute | 42.0 /100 | #182 | Average 98.0% |
| Portuguese | 41.8 /100 | #183 | Average 98.0% |
| Immigrants | Poland | 41.3 /100 | #184 | Average 98.0% |
| Immigrants | Belarus | 41.0 /100 | #185 | Average 98.0% |
| Immigrants | Argentina | 40.8 /100 | #186 | Average 98.0% |
| Immigrants | Kazakhstan | 37.1 /100 | #187 | Fair 97.9% |
| Arabs | 34.7 /100 | #188 | Fair 97.9% |
| Pakistanis | 34.6 /100 | #189 | Fair 97.9% |
| Panamanians | 34.3 /100 | #190 | Fair 97.9% |
| Immigrants | Taiwan | 30.6 /100 | #191 | Fair 97.9% |
| Blacks/African Americans | 29.4 /100 | #192 | Fair 97.9% |
| Paraguayans | 27.4 /100 | #193 | Fair 97.9% |