Immigrants from North America vs Hungarian 8th Grade
COMPARE
Immigrants from North America
Hungarian
8th Grade
8th Grade Comparison
Immigrants from North America
Hungarians
96.7%
8TH GRADE
99.8/ 100
METRIC RATING
59th/ 347
METRIC RANK
97.0%
8TH GRADE
100.0/ 100
METRIC RATING
39th/ 347
METRIC RANK
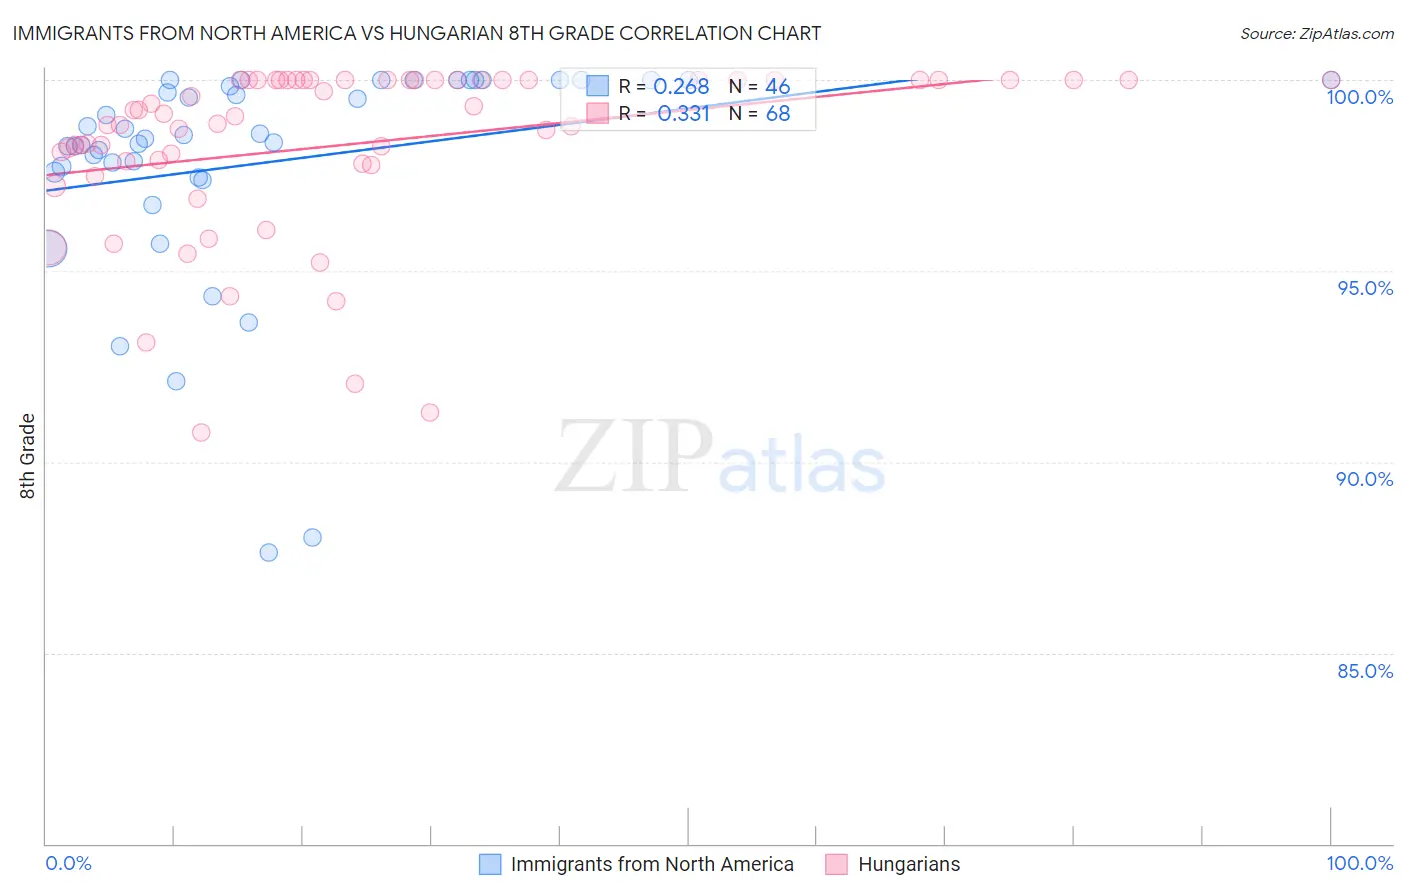
Immigrants from North America vs Hungarian 8th Grade Correlation Chart
The statistical analysis conducted on geographies consisting of 462,462,330 people shows a weak positive correlation between the proportion of Immigrants from North America and percentage of population with at least 8th grade education in the United States with a correlation coefficient (R) of 0.268 and weighted average of 96.7%. Similarly, the statistical analysis conducted on geographies consisting of 486,239,439 people shows a mild positive correlation between the proportion of Hungarians and percentage of population with at least 8th grade education in the United States with a correlation coefficient (R) of 0.331 and weighted average of 97.0%, a difference of 0.30%.
8th Grade Correlation Summary
| Measurement | Immigrants from North America | Hungarian |
| Minimum | 87.6% | 90.8% |
| Maximum | 100.0% | 100.0% |
| Range | 12.4% | 9.2% |
| Mean | 97.8% | 98.3% |
| Median | 98.5% | 99.1% |
| Interquartile 25% (IQ1) | 97.6% | 97.8% |
| Interquartile 75% (IQ3) | 100.0% | 100.0% |
| Interquartile Range (IQR) | 2.4% | 2.2% |
| Standard Deviation (Sample) | 2.9% | 2.3% |
| Standard Deviation (Population) | 2.9% | 2.2% |
Demographics Similar to Immigrants from North America and Hungarians by 8th Grade
In terms of 8th grade, the demographic groups most similar to Immigrants from North America are Immigrants from Canada (96.7%, a difference of 0.010%), Macedonian (96.7%, a difference of 0.050%), Serbian (96.7%, a difference of 0.060%), Russian (96.7%, a difference of 0.060%), and Australian (96.7%, a difference of 0.060%). Similarly, the demographic groups most similar to Hungarians are Inupiat (97.0%, a difference of 0.010%), Eastern European (97.0%, a difference of 0.020%), Chinese (96.9%, a difference of 0.060%), Aleut (96.9%, a difference of 0.090%), and Maltese (96.9%, a difference of 0.11%).
| Demographics | Rating | Rank | 8th Grade |
| Hungarians | 100.0 /100 | #39 | Exceptional 97.0% |
| Inupiat | 100.0 /100 | #40 | Exceptional 97.0% |
| Eastern Europeans | 100.0 /100 | #41 | Exceptional 97.0% |
| Chinese | 100.0 /100 | #42 | Exceptional 96.9% |
| Aleuts | 99.9 /100 | #43 | Exceptional 96.9% |
| Maltese | 99.9 /100 | #44 | Exceptional 96.9% |
| Northern Europeans | 99.9 /100 | #45 | Exceptional 96.9% |
| Czechoslovakians | 99.9 /100 | #46 | Exceptional 96.9% |
| Bulgarians | 99.9 /100 | #47 | Exceptional 96.9% |
| Slavs | 99.9 /100 | #48 | Exceptional 96.8% |
| Estonians | 99.9 /100 | #49 | Exceptional 96.8% |
| Immigrants | Scotland | 99.9 /100 | #50 | Exceptional 96.8% |
| Celtics | 99.9 /100 | #51 | Exceptional 96.8% |
| Greeks | 99.9 /100 | #52 | Exceptional 96.8% |
| Austrians | 99.9 /100 | #53 | Exceptional 96.7% |
| Serbians | 99.8 /100 | #54 | Exceptional 96.7% |
| Russians | 99.8 /100 | #55 | Exceptional 96.7% |
| Australians | 99.8 /100 | #56 | Exceptional 96.7% |
| Macedonians | 99.8 /100 | #57 | Exceptional 96.7% |
| Immigrants | Canada | 99.8 /100 | #58 | Exceptional 96.7% |
| Immigrants | North America | 99.8 /100 | #59 | Exceptional 96.7% |