U.S. Virgin Islander vs Hungarian 8th Grade
COMPARE
U.S. Virgin Islander
Hungarian
8th Grade
8th Grade Comparison
U.S. Virgin Islanders
Hungarians
95.0%
8TH GRADE
0.9/ 100
METRIC RATING
253rd/ 347
METRIC RANK
97.0%
8TH GRADE
100.0/ 100
METRIC RATING
39th/ 347
METRIC RANK
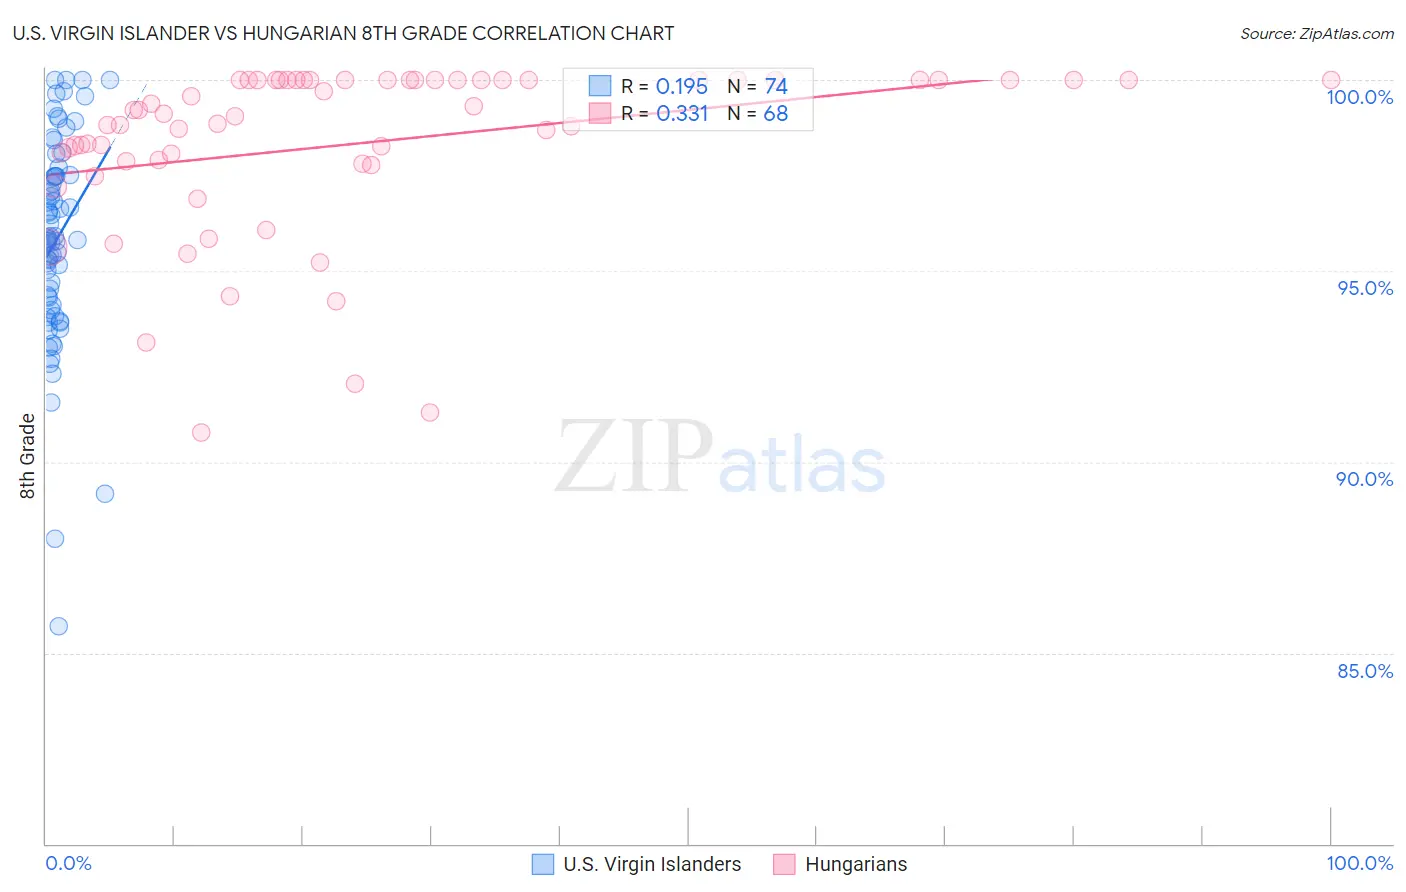
U.S. Virgin Islander vs Hungarian 8th Grade Correlation Chart
The statistical analysis conducted on geographies consisting of 87,529,315 people shows a poor positive correlation between the proportion of U.S. Virgin Islanders and percentage of population with at least 8th grade education in the United States with a correlation coefficient (R) of 0.195 and weighted average of 95.0%. Similarly, the statistical analysis conducted on geographies consisting of 486,239,439 people shows a mild positive correlation between the proportion of Hungarians and percentage of population with at least 8th grade education in the United States with a correlation coefficient (R) of 0.331 and weighted average of 97.0%, a difference of 2.1%.
8th Grade Correlation Summary
| Measurement | U.S. Virgin Islander | Hungarian |
| Minimum | 85.7% | 90.8% |
| Maximum | 100.0% | 100.0% |
| Range | 14.3% | 9.2% |
| Mean | 95.8% | 98.3% |
| Median | 95.9% | 99.1% |
| Interquartile 25% (IQ1) | 94.1% | 97.8% |
| Interquartile 75% (IQ3) | 97.5% | 100.0% |
| Interquartile Range (IQR) | 3.4% | 2.2% |
| Standard Deviation (Sample) | 2.7% | 2.3% |
| Standard Deviation (Population) | 2.7% | 2.2% |
Similar Demographics by 8th Grade
Demographics Similar to U.S. Virgin Islanders by 8th Grade
In terms of 8th grade, the demographic groups most similar to U.S. Virgin Islanders are Bolivian (95.0%, a difference of 0.010%), Immigrants from Ethiopia (95.0%, a difference of 0.010%), Korean (95.0%, a difference of 0.020%), Immigrants from Cameroon (95.0%, a difference of 0.020%), and Immigrants from China (95.0%, a difference of 0.030%).
| Demographics | Rating | Rank | 8th Grade |
| Somalis | 1.4 /100 | #246 | Tragic 95.1% |
| Immigrants | Senegal | 1.4 /100 | #247 | Tragic 95.1% |
| Uruguayans | 1.2 /100 | #248 | Tragic 95.1% |
| Immigrants | China | 1.1 /100 | #249 | Tragic 95.0% |
| Koreans | 1.1 /100 | #250 | Tragic 95.0% |
| Bolivians | 1.0 /100 | #251 | Tragic 95.0% |
| Immigrants | Ethiopia | 1.0 /100 | #252 | Tragic 95.0% |
| U.S. Virgin Islanders | 0.9 /100 | #253 | Tragic 95.0% |
| Immigrants | Cameroon | 0.8 /100 | #254 | Tragic 95.0% |
| Immigrants | Somalia | 0.7 /100 | #255 | Tragic 95.0% |
| Colombians | 0.7 /100 | #256 | Tragic 95.0% |
| Afghans | 0.6 /100 | #257 | Tragic 94.9% |
| Immigrants | Congo | 0.6 /100 | #258 | Tragic 94.9% |
| Ghanaians | 0.6 /100 | #259 | Tragic 94.9% |
| Immigrants | Jamaica | 0.6 /100 | #260 | Tragic 94.9% |
Demographics Similar to Hungarians by 8th Grade
In terms of 8th grade, the demographic groups most similar to Hungarians are British (97.0%, a difference of 0.0%), Inupiat (97.0%, a difference of 0.010%), Belgian (97.0%, a difference of 0.020%), Latvian (97.0%, a difference of 0.020%), and Eastern European (97.0%, a difference of 0.020%).
| Demographics | Rating | Rank | 8th Grade |
| Yup'ik | 100.0 /100 | #32 | Exceptional 97.0% |
| Swiss | 100.0 /100 | #33 | Exceptional 97.0% |
| Luxembourgers | 100.0 /100 | #34 | Exceptional 97.0% |
| Alaska Natives | 100.0 /100 | #35 | Exceptional 97.0% |
| Belgians | 100.0 /100 | #36 | Exceptional 97.0% |
| Latvians | 100.0 /100 | #37 | Exceptional 97.0% |
| British | 100.0 /100 | #38 | Exceptional 97.0% |
| Hungarians | 100.0 /100 | #39 | Exceptional 97.0% |
| Inupiat | 100.0 /100 | #40 | Exceptional 97.0% |
| Eastern Europeans | 100.0 /100 | #41 | Exceptional 97.0% |
| Chinese | 100.0 /100 | #42 | Exceptional 96.9% |
| Aleuts | 99.9 /100 | #43 | Exceptional 96.9% |
| Maltese | 99.9 /100 | #44 | Exceptional 96.9% |
| Northern Europeans | 99.9 /100 | #45 | Exceptional 96.9% |
| Czechoslovakians | 99.9 /100 | #46 | Exceptional 96.9% |