Immigrants from Kazakhstan vs Colombian Master's Degree
COMPARE
Immigrants from Kazakhstan
Colombian
Master's Degree
Master's Degree Comparison
Immigrants from Kazakhstan
Colombians
18.0%
MASTER'S DEGREE
99.8/ 100
METRIC RATING
65th/ 347
METRIC RANK
15.3%
MASTER'S DEGREE
66.9/ 100
METRIC RATING
164th/ 347
METRIC RANK
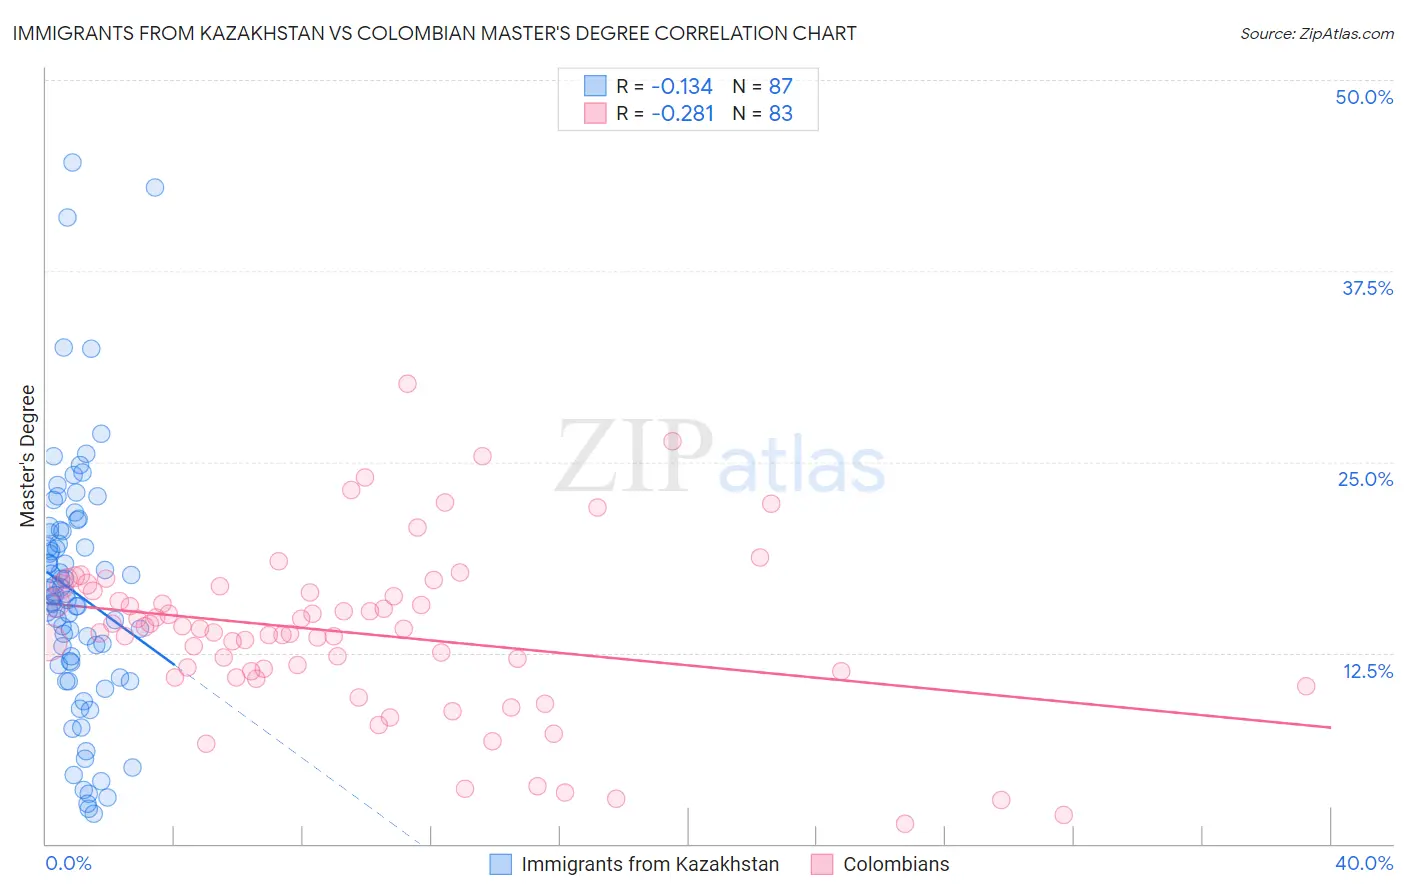
Immigrants from Kazakhstan vs Colombian Master's Degree Correlation Chart
The statistical analysis conducted on geographies consisting of 124,419,458 people shows a poor negative correlation between the proportion of Immigrants from Kazakhstan and percentage of population with at least master's degree education in the United States with a correlation coefficient (R) of -0.134 and weighted average of 18.0%. Similarly, the statistical analysis conducted on geographies consisting of 419,504,148 people shows a weak negative correlation between the proportion of Colombians and percentage of population with at least master's degree education in the United States with a correlation coefficient (R) of -0.281 and weighted average of 15.3%, a difference of 17.8%.
Master's Degree Correlation Summary
| Measurement | Immigrants from Kazakhstan | Colombian |
| Minimum | 1.9% | 1.3% |
| Maximum | 44.6% | 30.1% |
| Range | 42.7% | 28.8% |
| Mean | 16.4% | 13.8% |
| Median | 16.2% | 14.1% |
| Interquartile 25% (IQ1) | 11.7% | 11.3% |
| Interquartile 75% (IQ3) | 20.5% | 16.5% |
| Interquartile Range (IQR) | 8.7% | 5.3% |
| Standard Deviation (Sample) | 8.3% | 5.5% |
| Standard Deviation (Population) | 8.2% | 5.4% |
Similar Demographics by Master's Degree
Demographics Similar to Immigrants from Kazakhstan by Master's Degree
In terms of master's degree, the demographic groups most similar to Immigrants from Kazakhstan are Ethiopian (18.0%, a difference of 0.020%), Immigrants from Argentina (18.0%, a difference of 0.070%), Immigrants from Ethiopia (17.9%, a difference of 0.30%), Immigrants from Uzbekistan (17.9%, a difference of 0.62%), and South African (18.1%, a difference of 0.70%).
| Demographics | Rating | Rank | Master's Degree |
| Australians | 99.9 /100 | #58 | Exceptional 18.4% |
| Immigrants | Bulgaria | 99.9 /100 | #59 | Exceptional 18.3% |
| New Zealanders | 99.9 /100 | #60 | Exceptional 18.3% |
| Immigrants | Europe | 99.9 /100 | #61 | Exceptional 18.2% |
| Argentineans | 99.9 /100 | #62 | Exceptional 18.2% |
| Immigrants | Netherlands | 99.9 /100 | #63 | Exceptional 18.1% |
| South Africans | 99.9 /100 | #64 | Exceptional 18.1% |
| Immigrants | Kazakhstan | 99.8 /100 | #65 | Exceptional 18.0% |
| Ethiopians | 99.8 /100 | #66 | Exceptional 18.0% |
| Immigrants | Argentina | 99.8 /100 | #67 | Exceptional 18.0% |
| Immigrants | Ethiopia | 99.8 /100 | #68 | Exceptional 17.9% |
| Immigrants | Uzbekistan | 99.8 /100 | #69 | Exceptional 17.9% |
| Immigrants | Western Europe | 99.8 /100 | #70 | Exceptional 17.8% |
| Immigrants | Pakistan | 99.7 /100 | #71 | Exceptional 17.8% |
| Lithuanians | 99.7 /100 | #72 | Exceptional 17.7% |
Demographics Similar to Colombians by Master's Degree
In terms of master's degree, the demographic groups most similar to Colombians are Uruguayan (15.3%, a difference of 0.030%), Immigrants from Kenya (15.3%, a difference of 0.040%), Swedish (15.2%, a difference of 0.11%), Senegalese (15.2%, a difference of 0.19%), and Peruvian (15.3%, a difference of 0.25%).
| Demographics | Rating | Rank | Master's Degree |
| Immigrants | Cameroon | 71.7 /100 | #157 | Good 15.4% |
| Immigrants | Poland | 71.5 /100 | #158 | Good 15.4% |
| Luxembourgers | 71.0 /100 | #159 | Good 15.3% |
| Kenyans | 70.3 /100 | #160 | Good 15.3% |
| Sudanese | 68.7 /100 | #161 | Good 15.3% |
| Peruvians | 68.7 /100 | #162 | Good 15.3% |
| Uruguayans | 67.1 /100 | #163 | Good 15.3% |
| Colombians | 66.9 /100 | #164 | Good 15.3% |
| Immigrants | Kenya | 66.6 /100 | #165 | Good 15.3% |
| Swedes | 66.1 /100 | #166 | Good 15.2% |
| Senegalese | 65.6 /100 | #167 | Good 15.2% |
| Immigrants | North Macedonia | 64.5 /100 | #168 | Good 15.2% |
| Scottish | 62.7 /100 | #169 | Good 15.2% |
| Irish | 56.3 /100 | #170 | Average 15.0% |
| Immigrants | Ghana | 53.6 /100 | #171 | Average 15.0% |