Scandinavian vs Bhutanese 4th Grade
COMPARE
Scandinavian
Bhutanese
4th Grade
4th Grade Comparison
Scandinavians
Bhutanese
98.3%
4TH GRADE
100.0/ 100
METRIC RATING
30th/ 347
METRIC RANK
97.9%
4TH GRADE
97.4/ 100
METRIC RATING
107th/ 347
METRIC RANK
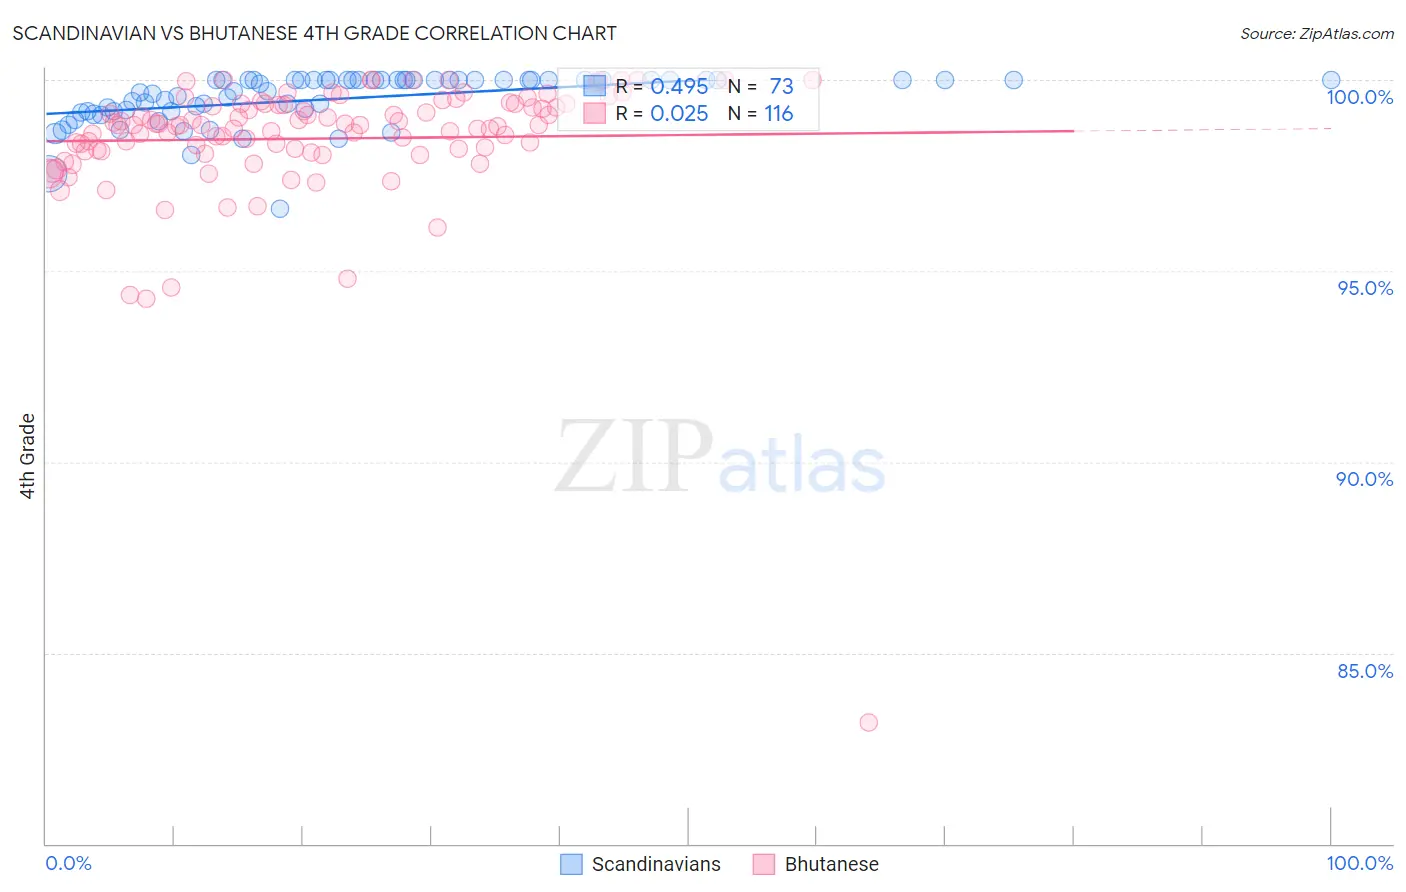
Scandinavian vs Bhutanese 4th Grade Correlation Chart
The statistical analysis conducted on geographies consisting of 472,660,430 people shows a moderate positive correlation between the proportion of Scandinavians and percentage of population with at least 4th grade education in the United States with a correlation coefficient (R) of 0.495 and weighted average of 98.3%. Similarly, the statistical analysis conducted on geographies consisting of 455,591,134 people shows no correlation between the proportion of Bhutanese and percentage of population with at least 4th grade education in the United States with a correlation coefficient (R) of 0.025 and weighted average of 97.9%, a difference of 0.44%.
4th Grade Correlation Summary
| Measurement | Scandinavian | Bhutanese |
| Minimum | 96.6% | 83.2% |
| Maximum | 100.0% | 100.0% |
| Range | 3.4% | 16.8% |
| Mean | 99.5% | 98.5% |
| Median | 99.9% | 98.8% |
| Interquartile 25% (IQ1) | 99.2% | 98.2% |
| Interquartile 75% (IQ3) | 100.0% | 99.4% |
| Interquartile Range (IQR) | 0.82% | 1.2% |
| Standard Deviation (Sample) | 0.67% | 1.8% |
| Standard Deviation (Population) | 0.66% | 1.8% |
Similar Demographics by 4th Grade
Demographics Similar to Scandinavians by 4th Grade
In terms of 4th grade, the demographic groups most similar to Scandinavians are European (98.3%, a difference of 0.0%), Czech (98.3%, a difference of 0.010%), French Canadian (98.3%, a difference of 0.020%), French (98.3%, a difference of 0.020%), and Scotch-Irish (98.3%, a difference of 0.030%).
| Demographics | Rating | Rank | 4th Grade |
| Sioux | 100.0 /100 | #23 | Exceptional 98.3% |
| Danes | 100.0 /100 | #24 | Exceptional 98.3% |
| Scotch-Irish | 100.0 /100 | #25 | Exceptional 98.3% |
| Croatians | 100.0 /100 | #26 | Exceptional 98.3% |
| French Canadians | 100.0 /100 | #27 | Exceptional 98.3% |
| French | 100.0 /100 | #28 | Exceptional 98.3% |
| Czechs | 100.0 /100 | #29 | Exceptional 98.3% |
| Scandinavians | 100.0 /100 | #30 | Exceptional 98.3% |
| Europeans | 100.0 /100 | #31 | Exceptional 98.3% |
| Chinese | 100.0 /100 | #32 | Exceptional 98.3% |
| Swiss | 100.0 /100 | #33 | Exceptional 98.2% |
| Chippewa | 100.0 /100 | #34 | Exceptional 98.2% |
| Italians | 100.0 /100 | #35 | Exceptional 98.2% |
| British | 100.0 /100 | #36 | Exceptional 98.2% |
| Latvians | 99.9 /100 | #37 | Exceptional 98.2% |
Demographics Similar to Bhutanese by 4th Grade
In terms of 4th grade, the demographic groups most similar to Bhutanese are Immigrants from Czechoslovakia (97.9%, a difference of 0.0%), Immigrants from Singapore (97.9%, a difference of 0.0%), Puget Sound Salish (97.9%, a difference of 0.010%), Nonimmigrants (97.9%, a difference of 0.010%), and German Russian (97.9%, a difference of 0.010%).
| Demographics | Rating | Rank | 4th Grade |
| Yugoslavians | 98.1 /100 | #100 | Exceptional 97.9% |
| Cree | 98.1 /100 | #101 | Exceptional 97.9% |
| Choctaw | 97.9 /100 | #102 | Exceptional 97.9% |
| Puget Sound Salish | 97.7 /100 | #103 | Exceptional 97.9% |
| Immigrants | Nonimmigrants | 97.5 /100 | #104 | Exceptional 97.9% |
| German Russians | 97.5 /100 | #105 | Exceptional 97.9% |
| Immigrants | Czechoslovakia | 97.5 /100 | #106 | Exceptional 97.9% |
| Bhutanese | 97.4 /100 | #107 | Exceptional 97.9% |
| Immigrants | Singapore | 97.3 /100 | #108 | Exceptional 97.9% |
| Immigrants | Latvia | 96.8 /100 | #109 | Exceptional 97.8% |
| Thais | 96.7 /100 | #110 | Exceptional 97.8% |
| Immigrants | Switzerland | 96.1 /100 | #111 | Exceptional 97.8% |
| Okinawans | 96.0 /100 | #112 | Exceptional 97.8% |
| Basques | 95.8 /100 | #113 | Exceptional 97.8% |
| Iroquois | 95.4 /100 | #114 | Exceptional 97.8% |