Immigrants from Jordan vs Immigrants from the Azores High School Diploma
COMPARE
Immigrants from Jordan
Immigrants from the Azores
High School Diploma
High School Diploma Comparison
Immigrants from Jordan
Immigrants from the Azores
89.8%
HIGH SCHOOL DIPLOMA
87.2/ 100
METRIC RATING
134th/ 347
METRIC RANK
82.8%
HIGH SCHOOL DIPLOMA
0.0/ 100
METRIC RATING
330th/ 347
METRIC RANK
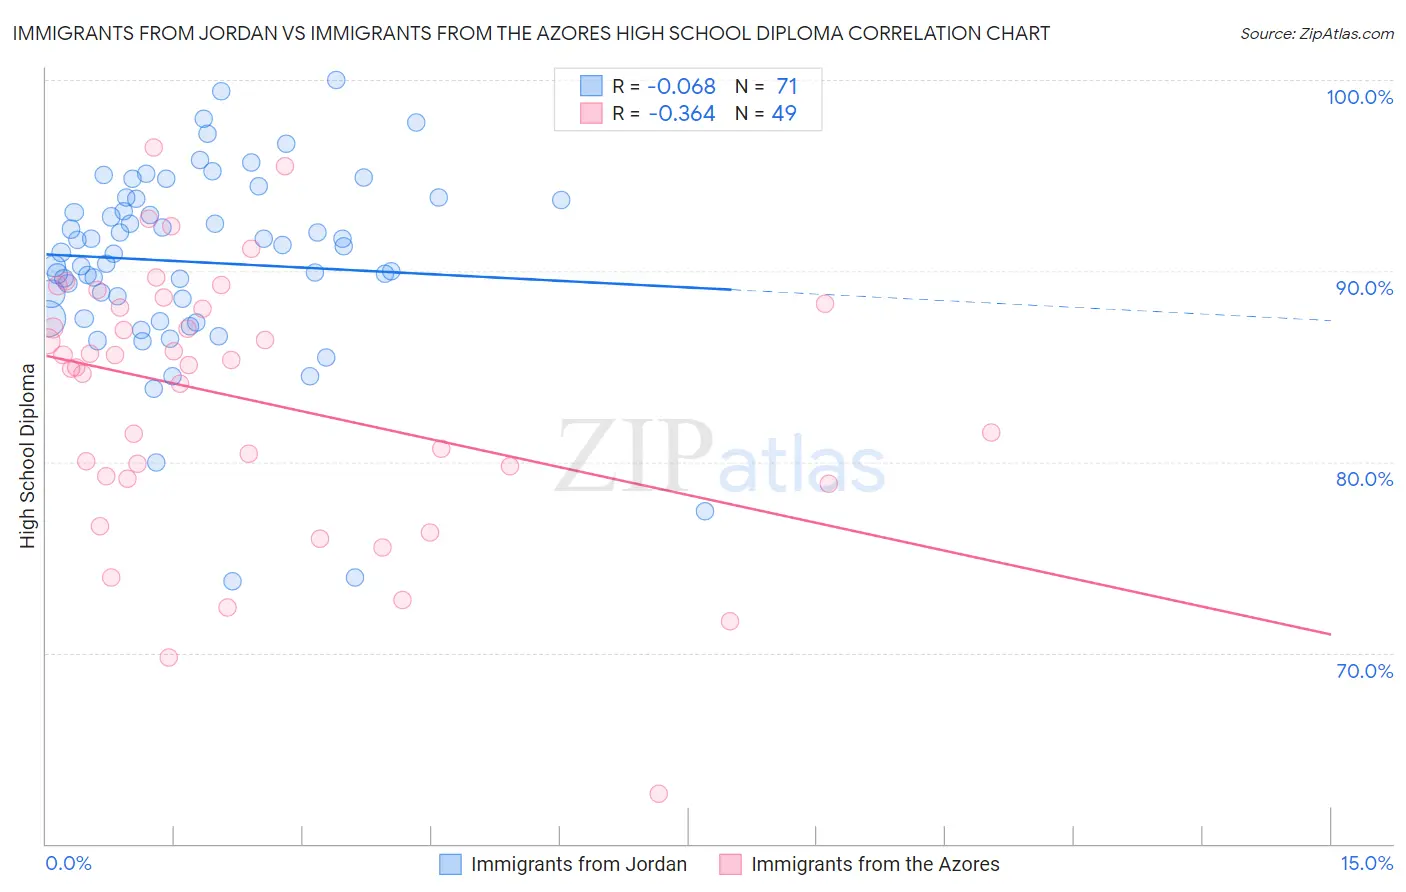
Immigrants from Jordan vs Immigrants from the Azores High School Diploma Correlation Chart
The statistical analysis conducted on geographies consisting of 181,278,272 people shows a slight negative correlation between the proportion of Immigrants from Jordan and percentage of population with at least high school diploma education in the United States with a correlation coefficient (R) of -0.068 and weighted average of 89.8%. Similarly, the statistical analysis conducted on geographies consisting of 46,257,310 people shows a mild negative correlation between the proportion of Immigrants from the Azores and percentage of population with at least high school diploma education in the United States with a correlation coefficient (R) of -0.364 and weighted average of 82.8%, a difference of 8.4%.
High School Diploma Correlation Summary
| Measurement | Immigrants from Jordan | Immigrants from the Azores |
| Minimum | 73.8% | 62.6% |
| Maximum | 100.0% | 96.5% |
| Range | 26.2% | 33.8% |
| Mean | 90.5% | 83.3% |
| Median | 91.0% | 85.1% |
| Interquartile 25% (IQ1) | 87.5% | 79.2% |
| Interquartile 75% (IQ3) | 93.8% | 88.2% |
| Interquartile Range (IQR) | 6.3% | 9.0% |
| Standard Deviation (Sample) | 5.0% | 6.9% |
| Standard Deviation (Population) | 5.0% | 6.9% |
Similar Demographics by High School Diploma
Demographics Similar to Immigrants from Jordan by High School Diploma
In terms of high school diploma, the demographic groups most similar to Immigrants from Jordan are Immigrants from Bosnia and Herzegovina (89.8%, a difference of 0.0%), Albanian (89.8%, a difference of 0.0%), Immigrants from Italy (89.8%, a difference of 0.010%), Immigrants from Ukraine (89.8%, a difference of 0.020%), and Basque (89.8%, a difference of 0.050%).
| Demographics | Rating | Rank | High School Diploma |
| Immigrants | Eastern Asia | 89.2 /100 | #127 | Excellent 89.9% |
| Puget Sound Salish | 89.1 /100 | #128 | Excellent 89.9% |
| Basques | 88.5 /100 | #129 | Excellent 89.8% |
| Immigrants | Ukraine | 87.9 /100 | #130 | Excellent 89.8% |
| Immigrants | Italy | 87.4 /100 | #131 | Excellent 89.8% |
| Immigrants | Bosnia and Herzegovina | 87.3 /100 | #132 | Excellent 89.8% |
| Albanians | 87.2 /100 | #133 | Excellent 89.8% |
| Immigrants | Jordan | 87.2 /100 | #134 | Excellent 89.8% |
| Chippewa | 85.6 /100 | #135 | Excellent 89.7% |
| Ugandans | 83.7 /100 | #136 | Excellent 89.7% |
| Arabs | 83.6 /100 | #137 | Excellent 89.7% |
| Assyrians/Chaldeans/Syriacs | 82.5 /100 | #138 | Excellent 89.7% |
| Kenyans | 81.4 /100 | #139 | Excellent 89.6% |
| Immigrants | Egypt | 81.2 /100 | #140 | Excellent 89.6% |
| Chileans | 79.0 /100 | #141 | Good 89.6% |
Demographics Similar to Immigrants from the Azores by High School Diploma
In terms of high school diploma, the demographic groups most similar to Immigrants from the Azores are Hispanic or Latino (82.9%, a difference of 0.080%), Dominican (82.9%, a difference of 0.17%), Honduran (83.0%, a difference of 0.22%), Mexican American Indian (83.0%, a difference of 0.26%), and Central American (82.5%, a difference of 0.31%).
| Demographics | Rating | Rank | High School Diploma |
| Immigrants | Cuba | 0.0 /100 | #323 | Tragic 83.5% |
| Immigrants | Cabo Verde | 0.0 /100 | #324 | Tragic 83.3% |
| Immigrants | Nicaragua | 0.0 /100 | #325 | Tragic 83.1% |
| Mexican American Indians | 0.0 /100 | #326 | Tragic 83.0% |
| Hondurans | 0.0 /100 | #327 | Tragic 83.0% |
| Dominicans | 0.0 /100 | #328 | Tragic 82.9% |
| Hispanics or Latinos | 0.0 /100 | #329 | Tragic 82.9% |
| Immigrants | Azores | 0.0 /100 | #330 | Tragic 82.8% |
| Central Americans | 0.0 /100 | #331 | Tragic 82.5% |
| Immigrants | Honduras | 0.0 /100 | #332 | Tragic 82.5% |
| Immigrants | Latin America | 0.0 /100 | #333 | Tragic 82.1% |
| Tohono O'odham | 0.0 /100 | #334 | Tragic 82.1% |
| Guatemalans | 0.0 /100 | #335 | Tragic 82.0% |
| Immigrants | Dominican Republic | 0.0 /100 | #336 | Tragic 82.0% |
| Immigrants | Yemen | 0.0 /100 | #337 | Tragic 81.8% |