Yaqui vs Tohono O'odham High School Diploma
COMPARE
Yaqui
Tohono O'odham
High School Diploma
High School Diploma Comparison
Yaqui
Tohono O'odham
84.7%
HIGH SCHOOL DIPLOMA
0.0/ 100
METRIC RATING
314th/ 347
METRIC RANK
82.1%
HIGH SCHOOL DIPLOMA
0.0/ 100
METRIC RATING
334th/ 347
METRIC RANK
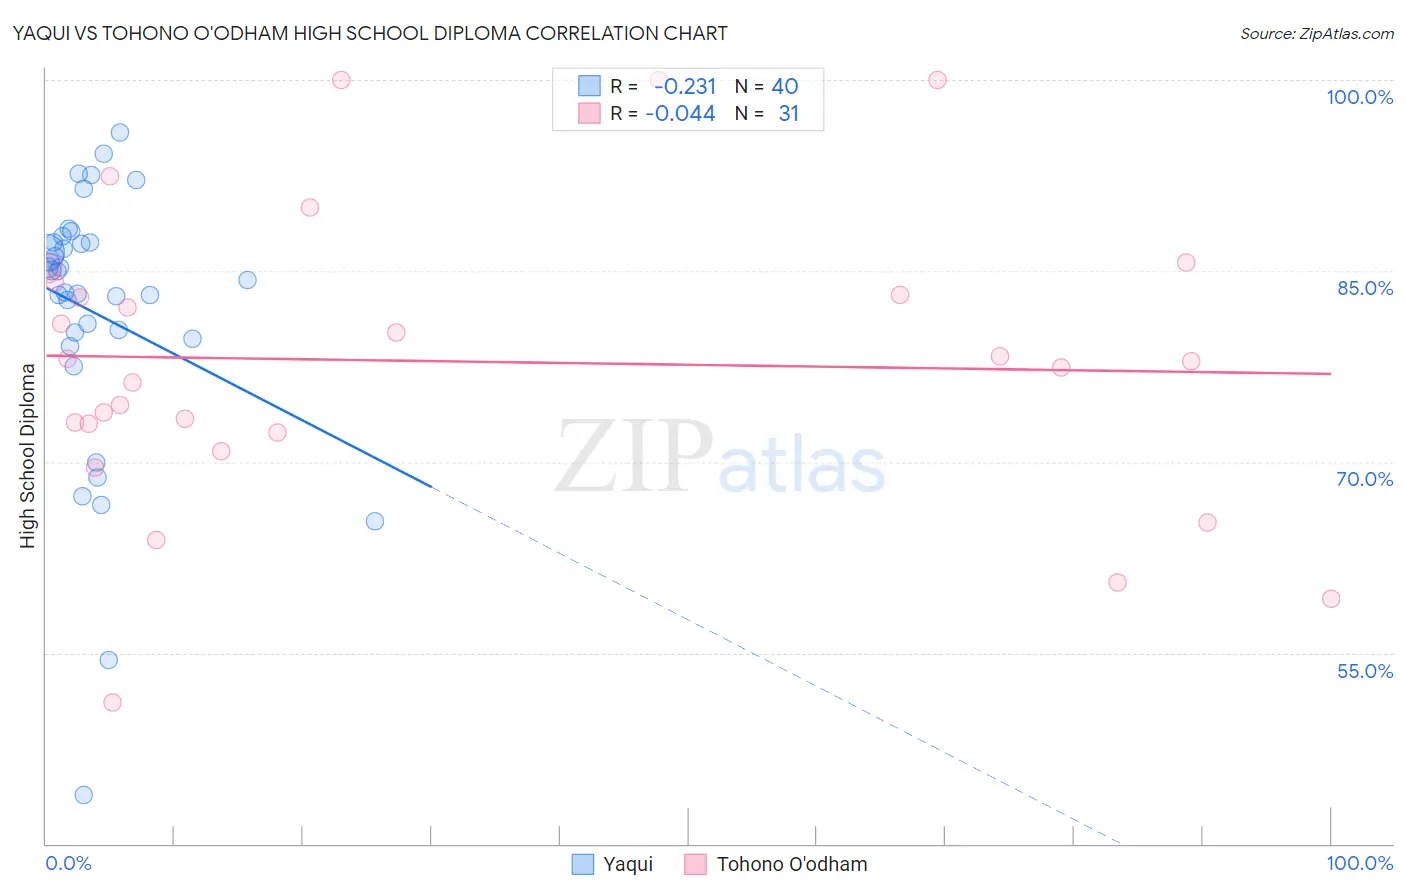
Yaqui vs Tohono O'odham High School Diploma Correlation Chart
The statistical analysis conducted on geographies consisting of 107,732,380 people shows a weak negative correlation between the proportion of Yaqui and percentage of population with at least high school diploma education in the United States with a correlation coefficient (R) of -0.231 and weighted average of 84.7%. Similarly, the statistical analysis conducted on geographies consisting of 58,730,615 people shows no correlation between the proportion of Tohono O'odham and percentage of population with at least high school diploma education in the United States with a correlation coefficient (R) of -0.044 and weighted average of 82.1%, a difference of 3.3%.
High School Diploma Correlation Summary
| Measurement | Yaqui | Tohono O'odham |
| Minimum | 43.8% | 51.1% |
| Maximum | 95.8% | 100.0% |
| Range | 52.1% | 48.9% |
| Mean | 81.7% | 77.9% |
| Median | 84.6% | 77.9% |
| Interquartile 25% (IQ1) | 79.9% | 72.3% |
| Interquartile 75% (IQ3) | 87.3% | 84.1% |
| Interquartile Range (IQR) | 7.3% | 11.8% |
| Standard Deviation (Sample) | 10.6% | 11.6% |
| Standard Deviation (Population) | 10.5% | 11.4% |
Demographics Similar to Yaqui and Tohono O'odham by High School Diploma
In terms of high school diploma, the demographic groups most similar to Yaqui are Puerto Rican (84.7%, a difference of 0.10%), Belizean (84.3%, a difference of 0.50%), Immigrants from Caribbean (84.3%, a difference of 0.56%), Immigrants from Belize (84.2%, a difference of 0.63%), and Central American Indian (84.2%, a difference of 0.66%). Similarly, the demographic groups most similar to Tohono O'odham are Immigrants from Latin America (82.1%, a difference of 0.11%), Immigrants from Honduras (82.5%, a difference of 0.50%), Central American (82.5%, a difference of 0.60%), Immigrants from the Azores (82.8%, a difference of 0.91%), and Hispanic or Latino (82.9%, a difference of 0.99%).
| Demographics | Rating | Rank | High School Diploma |
| Yaqui | 0.0 /100 | #314 | Tragic 84.7% |
| Puerto Ricans | 0.0 /100 | #315 | Tragic 84.7% |
| Belizeans | 0.0 /100 | #316 | Tragic 84.3% |
| Immigrants | Caribbean | 0.0 /100 | #317 | Tragic 84.3% |
| Immigrants | Belize | 0.0 /100 | #318 | Tragic 84.2% |
| Central American Indians | 0.0 /100 | #319 | Tragic 84.2% |
| Nicaraguans | 0.0 /100 | #320 | Tragic 84.1% |
| Yuman | 0.0 /100 | #321 | Tragic 84.0% |
| Lumbee | 0.0 /100 | #322 | Tragic 83.6% |
| Immigrants | Cuba | 0.0 /100 | #323 | Tragic 83.5% |
| Immigrants | Cabo Verde | 0.0 /100 | #324 | Tragic 83.3% |
| Immigrants | Nicaragua | 0.0 /100 | #325 | Tragic 83.1% |
| Mexican American Indians | 0.0 /100 | #326 | Tragic 83.0% |
| Hondurans | 0.0 /100 | #327 | Tragic 83.0% |
| Dominicans | 0.0 /100 | #328 | Tragic 82.9% |
| Hispanics or Latinos | 0.0 /100 | #329 | Tragic 82.9% |
| Immigrants | Azores | 0.0 /100 | #330 | Tragic 82.8% |
| Central Americans | 0.0 /100 | #331 | Tragic 82.5% |
| Immigrants | Honduras | 0.0 /100 | #332 | Tragic 82.5% |
| Immigrants | Latin America | 0.0 /100 | #333 | Tragic 82.1% |
| Tohono O'odham | 0.0 /100 | #334 | Tragic 82.1% |