Haitian vs Native/Alaskan 8th Grade
COMPARE
Haitian
Native/Alaskan
8th Grade
8th Grade Comparison
Haitians
Natives/Alaskans
94.2%
8TH GRADE
0.0/ 100
METRIC RATING
296th/ 347
METRIC RANK
95.2%
8TH GRADE
2.3/ 100
METRIC RATING
238th/ 347
METRIC RANK
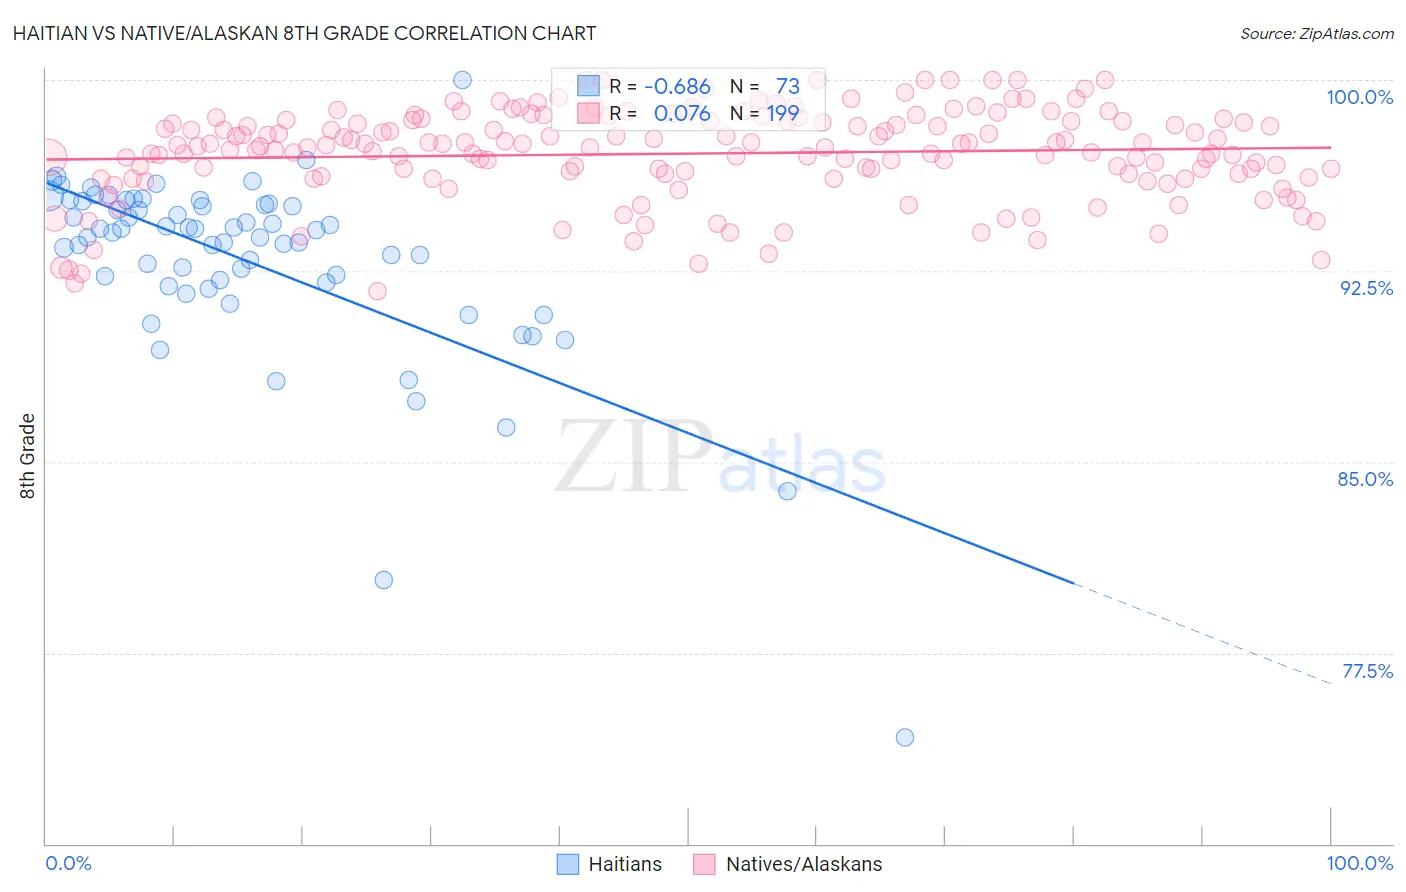
Haitian vs Native/Alaskan 8th Grade Correlation Chart
The statistical analysis conducted on geographies consisting of 287,965,116 people shows a significant negative correlation between the proportion of Haitians and percentage of population with at least 8th grade education in the United States with a correlation coefficient (R) of -0.686 and weighted average of 94.2%. Similarly, the statistical analysis conducted on geographies consisting of 513,072,559 people shows a slight positive correlation between the proportion of Natives/Alaskans and percentage of population with at least 8th grade education in the United States with a correlation coefficient (R) of 0.076 and weighted average of 95.2%, a difference of 1.0%.
8th Grade Correlation Summary
| Measurement | Haitian | Native/Alaskan |
| Minimum | 74.2% | 91.7% |
| Maximum | 100.0% | 100.0% |
| Range | 25.8% | 8.3% |
| Mean | 92.9% | 97.1% |
| Median | 94.0% | 97.4% |
| Interquartile 25% (IQ1) | 92.0% | 96.2% |
| Interquartile 75% (IQ3) | 95.1% | 98.4% |
| Interquartile Range (IQR) | 3.2% | 2.2% |
| Standard Deviation (Sample) | 3.7% | 1.8% |
| Standard Deviation (Population) | 3.7% | 1.8% |
Similar Demographics by 8th Grade
Demographics Similar to Haitians by 8th Grade
In terms of 8th grade, the demographic groups most similar to Haitians are Immigrants from South Eastern Asia (94.2%, a difference of 0.010%), Fijian (94.2%, a difference of 0.020%), Houma (94.2%, a difference of 0.030%), Yaqui (94.2%, a difference of 0.040%), and Indonesian (94.1%, a difference of 0.050%).
| Demographics | Rating | Rank | 8th Grade |
| British West Indians | 0.0 /100 | #289 | Tragic 94.4% |
| Immigrants | West Indies | 0.0 /100 | #290 | Tragic 94.3% |
| Immigrants | Grenada | 0.0 /100 | #291 | Tragic 94.3% |
| Bangladeshis | 0.0 /100 | #292 | Tragic 94.3% |
| Yaqui | 0.0 /100 | #293 | Tragic 94.2% |
| Houma | 0.0 /100 | #294 | Tragic 94.2% |
| Fijians | 0.0 /100 | #295 | Tragic 94.2% |
| Haitians | 0.0 /100 | #296 | Tragic 94.2% |
| Immigrants | South Eastern Asia | 0.0 /100 | #297 | Tragic 94.2% |
| Indonesians | 0.0 /100 | #298 | Tragic 94.1% |
| Cubans | 0.0 /100 | #299 | Tragic 94.1% |
| Immigrants | Burma/Myanmar | 0.0 /100 | #300 | Tragic 94.1% |
| Immigrants | Laos | 0.0 /100 | #301 | Tragic 94.1% |
| Sri Lankans | 0.0 /100 | #302 | Tragic 94.0% |
| Immigrants | Dominica | 0.0 /100 | #303 | Tragic 94.0% |
Demographics Similar to Natives/Alaskans by 8th Grade
In terms of 8th grade, the demographic groups most similar to Natives/Alaskans are Immigrants from Sierra Leone (95.1%, a difference of 0.020%), Ethiopian (95.1%, a difference of 0.020%), Senegalese (95.2%, a difference of 0.030%), Immigrants from Africa (95.2%, a difference of 0.030%), and South American Indian (95.1%, a difference of 0.030%).
| Demographics | Rating | Rank | 8th Grade |
| Asians | 3.5 /100 | #231 | Tragic 95.2% |
| Indians (Asian) | 3.3 /100 | #232 | Tragic 95.2% |
| Immigrants | Asia | 3.1 /100 | #233 | Tragic 95.2% |
| Costa Ricans | 3.0 /100 | #234 | Tragic 95.2% |
| Nigerians | 2.9 /100 | #235 | Tragic 95.2% |
| Senegalese | 2.7 /100 | #236 | Tragic 95.2% |
| Immigrants | Africa | 2.7 /100 | #237 | Tragic 95.2% |
| Natives/Alaskans | 2.3 /100 | #238 | Tragic 95.2% |
| Immigrants | Sierra Leone | 2.1 /100 | #239 | Tragic 95.1% |
| Ethiopians | 2.0 /100 | #240 | Tragic 95.1% |
| South American Indians | 1.9 /100 | #241 | Tragic 95.1% |
| Tongans | 1.7 /100 | #242 | Tragic 95.1% |
| Paiute | 1.7 /100 | #243 | Tragic 95.1% |
| Immigrants | Middle Africa | 1.7 /100 | #244 | Tragic 95.1% |
| Jamaicans | 1.4 /100 | #245 | Tragic 95.1% |