Immigrants from Haiti vs Native/Alaskan 8th Grade
COMPARE
Immigrants from Haiti
Native/Alaskan
8th Grade
8th Grade Comparison
Immigrants from Haiti
Natives/Alaskans
93.9%
8TH GRADE
0.0/ 100
METRIC RATING
305th/ 347
METRIC RANK
95.2%
8TH GRADE
2.3/ 100
METRIC RATING
238th/ 347
METRIC RANK
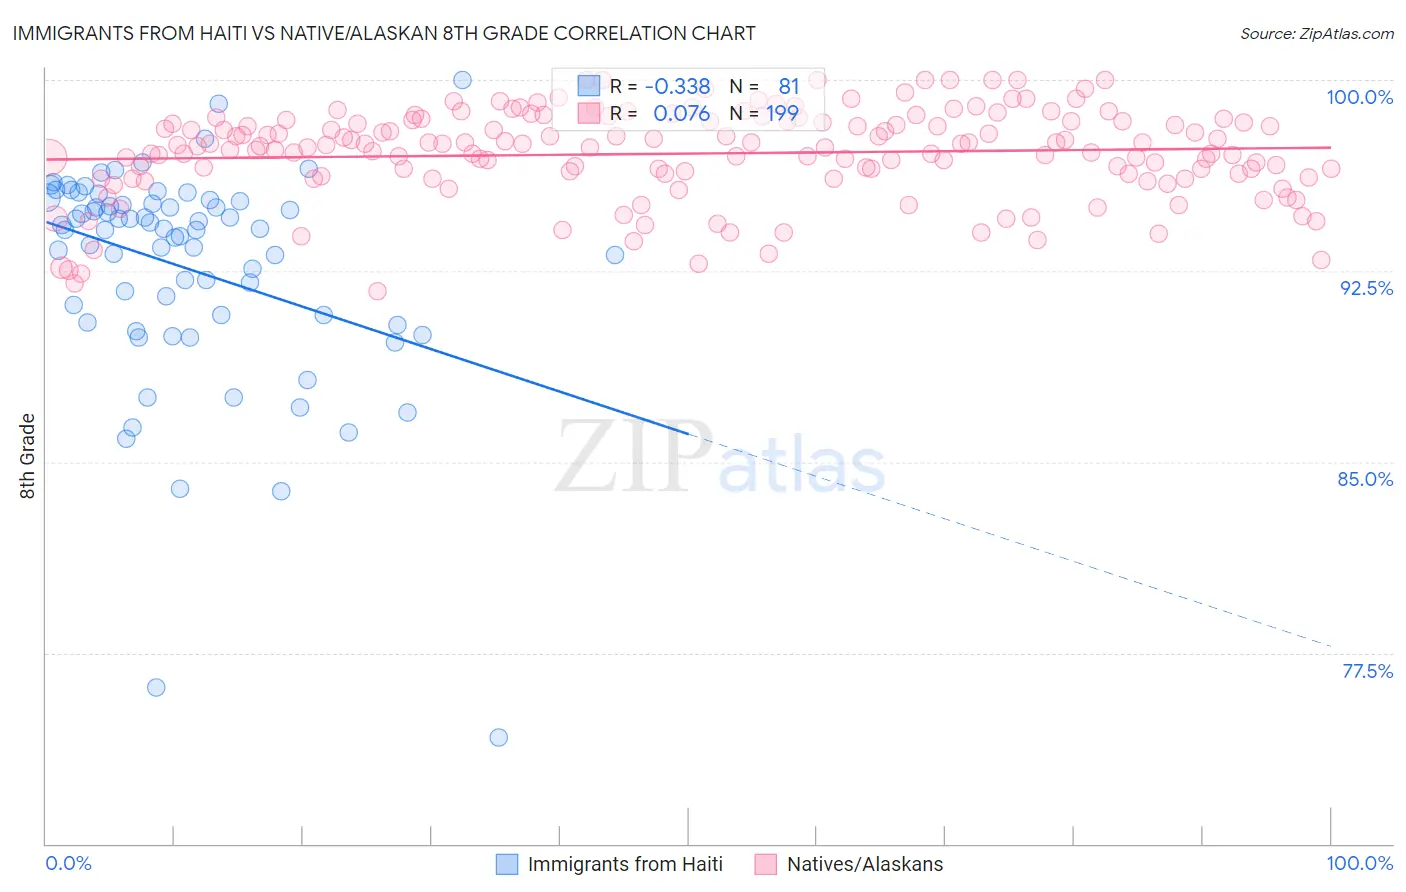
Immigrants from Haiti vs Native/Alaskan 8th Grade Correlation Chart
The statistical analysis conducted on geographies consisting of 225,286,322 people shows a mild negative correlation between the proportion of Immigrants from Haiti and percentage of population with at least 8th grade education in the United States with a correlation coefficient (R) of -0.338 and weighted average of 93.9%. Similarly, the statistical analysis conducted on geographies consisting of 513,072,559 people shows a slight positive correlation between the proportion of Natives/Alaskans and percentage of population with at least 8th grade education in the United States with a correlation coefficient (R) of 0.076 and weighted average of 95.2%, a difference of 1.4%.
8th Grade Correlation Summary
| Measurement | Immigrants from Haiti | Native/Alaskan |
| Minimum | 74.2% | 91.7% |
| Maximum | 100.0% | 100.0% |
| Range | 25.8% | 8.3% |
| Mean | 92.6% | 97.1% |
| Median | 94.1% | 97.4% |
| Interquartile 25% (IQ1) | 90.6% | 96.2% |
| Interquartile 75% (IQ3) | 95.2% | 98.4% |
| Interquartile Range (IQR) | 4.6% | 2.2% |
| Standard Deviation (Sample) | 4.3% | 1.8% |
| Standard Deviation (Population) | 4.3% | 1.8% |
Similar Demographics by 8th Grade
Demographics Similar to Immigrants from Haiti by 8th Grade
In terms of 8th grade, the demographic groups most similar to Immigrants from Haiti are Guyanese (93.9%, a difference of 0.030%), Immigrants from Guyana (93.8%, a difference of 0.090%), Immigrants from Portugal (93.8%, a difference of 0.11%), Immigrants from Dominica (94.0%, a difference of 0.12%), and Sri Lankan (94.0%, a difference of 0.16%).
| Demographics | Rating | Rank | 8th Grade |
| Indonesians | 0.0 /100 | #298 | Tragic 94.1% |
| Cubans | 0.0 /100 | #299 | Tragic 94.1% |
| Immigrants | Burma/Myanmar | 0.0 /100 | #300 | Tragic 94.1% |
| Immigrants | Laos | 0.0 /100 | #301 | Tragic 94.1% |
| Sri Lankans | 0.0 /100 | #302 | Tragic 94.0% |
| Immigrants | Dominica | 0.0 /100 | #303 | Tragic 94.0% |
| Guyanese | 0.0 /100 | #304 | Tragic 93.9% |
| Immigrants | Haiti | 0.0 /100 | #305 | Tragic 93.9% |
| Immigrants | Guyana | 0.0 /100 | #306 | Tragic 93.8% |
| Immigrants | Portugal | 0.0 /100 | #307 | Tragic 93.8% |
| Ecuadorians | 0.0 /100 | #308 | Tragic 93.6% |
| Immigrants | Immigrants | 0.0 /100 | #309 | Tragic 93.6% |
| Japanese | 0.0 /100 | #310 | Tragic 93.6% |
| Immigrants | Bangladesh | 0.0 /100 | #311 | Tragic 93.6% |
| Cape Verdeans | 0.0 /100 | #312 | Tragic 93.5% |
Demographics Similar to Natives/Alaskans by 8th Grade
In terms of 8th grade, the demographic groups most similar to Natives/Alaskans are Immigrants from Sierra Leone (95.1%, a difference of 0.020%), Ethiopian (95.1%, a difference of 0.020%), Senegalese (95.2%, a difference of 0.030%), Immigrants from Africa (95.2%, a difference of 0.030%), and South American Indian (95.1%, a difference of 0.030%).
| Demographics | Rating | Rank | 8th Grade |
| Asians | 3.5 /100 | #231 | Tragic 95.2% |
| Indians (Asian) | 3.3 /100 | #232 | Tragic 95.2% |
| Immigrants | Asia | 3.1 /100 | #233 | Tragic 95.2% |
| Costa Ricans | 3.0 /100 | #234 | Tragic 95.2% |
| Nigerians | 2.9 /100 | #235 | Tragic 95.2% |
| Senegalese | 2.7 /100 | #236 | Tragic 95.2% |
| Immigrants | Africa | 2.7 /100 | #237 | Tragic 95.2% |
| Natives/Alaskans | 2.3 /100 | #238 | Tragic 95.2% |
| Immigrants | Sierra Leone | 2.1 /100 | #239 | Tragic 95.1% |
| Ethiopians | 2.0 /100 | #240 | Tragic 95.1% |
| South American Indians | 1.9 /100 | #241 | Tragic 95.1% |
| Tongans | 1.7 /100 | #242 | Tragic 95.1% |
| Paiute | 1.7 /100 | #243 | Tragic 95.1% |
| Immigrants | Middle Africa | 1.7 /100 | #244 | Tragic 95.1% |
| Jamaicans | 1.4 /100 | #245 | Tragic 95.1% |