Yakama vs Lumbee Kindergarten
COMPARE
Yakama
Lumbee
Kindergarten
Kindergarten Comparison
Yakama
Lumbee
96.6%
KINDERGARTEN
0.0/ 100
METRIC RATING
332nd/ 347
METRIC RANK
98.5%
KINDERGARTEN
99.9/ 100
METRIC RATING
43rd/ 347
METRIC RANK
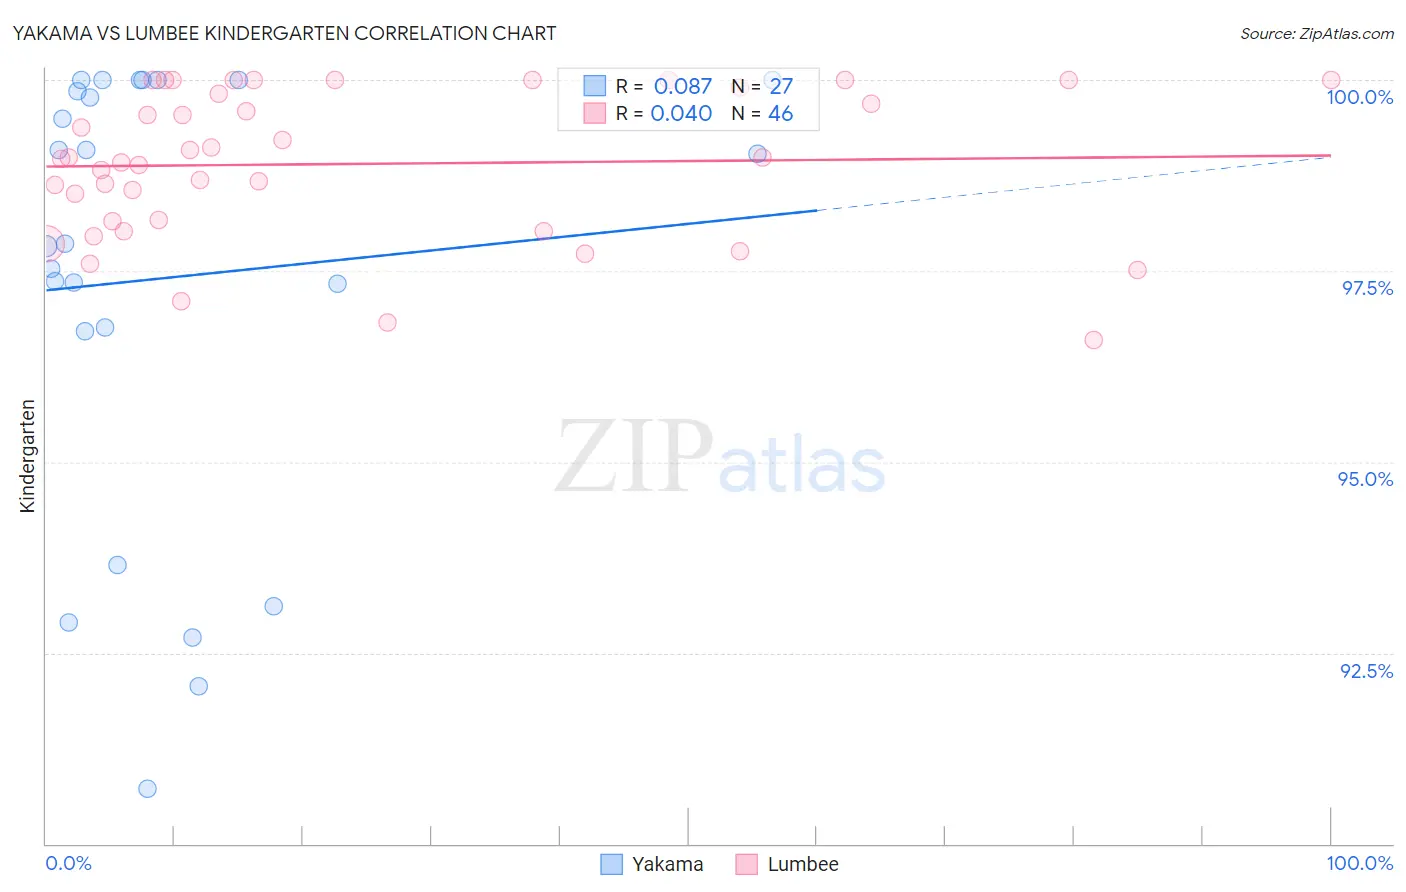
Yakama vs Lumbee Kindergarten Correlation Chart
The statistical analysis conducted on geographies consisting of 19,923,144 people shows a slight positive correlation between the proportion of Yakama and percentage of population with at least kindergarten education in the United States with a correlation coefficient (R) of 0.087 and weighted average of 96.6%. Similarly, the statistical analysis conducted on geographies consisting of 92,298,794 people shows no correlation between the proportion of Lumbee and percentage of population with at least kindergarten education in the United States with a correlation coefficient (R) of 0.040 and weighted average of 98.5%, a difference of 1.9%.
Kindergarten Correlation Summary
| Measurement | Yakama | Lumbee |
| Minimum | 90.7% | 96.6% |
| Maximum | 100.0% | 100.0% |
| Range | 9.3% | 3.4% |
| Mean | 97.4% | 98.9% |
| Median | 97.9% | 99.0% |
| Interquartile 25% (IQ1) | 96.7% | 98.1% |
| Interquartile 75% (IQ3) | 100.0% | 99.9% |
| Interquartile Range (IQR) | 3.3% | 1.8% |
| Standard Deviation (Sample) | 2.9% | 0.96% |
| Standard Deviation (Population) | 2.9% | 0.95% |
Similar Demographics by Kindergarten
Demographics Similar to Yakama by Kindergarten
In terms of kindergarten, the demographic groups most similar to Yakama are Immigrants from Armenia (96.6%, a difference of 0.020%), Central American (96.6%, a difference of 0.020%), Immigrants from Dominican Republic (96.6%, a difference of 0.040%), Immigrants from Vietnam (96.7%, a difference of 0.050%), and Japanese (96.7%, a difference of 0.050%).
| Demographics | Rating | Rank | Kindergarten |
| Indonesians | 0.0 /100 | #325 | Tragic 96.8% |
| Dominicans | 0.0 /100 | #326 | Tragic 96.8% |
| Mexicans | 0.0 /100 | #327 | Tragic 96.7% |
| Immigrants | Latin America | 0.0 /100 | #328 | Tragic 96.7% |
| Immigrants | Vietnam | 0.0 /100 | #329 | Tragic 96.7% |
| Japanese | 0.0 /100 | #330 | Tragic 96.7% |
| Immigrants | Armenia | 0.0 /100 | #331 | Tragic 96.6% |
| Yakama | 0.0 /100 | #332 | Tragic 96.6% |
| Central Americans | 0.0 /100 | #333 | Tragic 96.6% |
| Immigrants | Dominican Republic | 0.0 /100 | #334 | Tragic 96.6% |
| Bangladeshis | 0.0 /100 | #335 | Tragic 96.6% |
| Guatemalans | 0.0 /100 | #336 | Tragic 96.5% |
| Immigrants | Cambodia | 0.0 /100 | #337 | Tragic 96.5% |
| Immigrants | Fiji | 0.0 /100 | #338 | Tragic 96.5% |
| Immigrants | Guatemala | 0.0 /100 | #339 | Tragic 96.4% |
Demographics Similar to Lumbee by Kindergarten
In terms of kindergarten, the demographic groups most similar to Lumbee are Northern European (98.5%, a difference of 0.0%), Belgian (98.5%, a difference of 0.0%), Luxembourger (98.5%, a difference of 0.010%), Eastern European (98.5%, a difference of 0.010%), and Native Hawaiian (98.5%, a difference of 0.010%).
| Demographics | Rating | Rank | Kindergarten |
| British | 99.9 /100 | #36 | Exceptional 98.5% |
| Italians | 99.9 /100 | #37 | Exceptional 98.5% |
| Latvians | 99.9 /100 | #38 | Exceptional 98.5% |
| Chippewa | 99.9 /100 | #39 | Exceptional 98.5% |
| Luxembourgers | 99.9 /100 | #40 | Exceptional 98.5% |
| Eastern Europeans | 99.9 /100 | #41 | Exceptional 98.5% |
| Native Hawaiians | 99.9 /100 | #42 | Exceptional 98.5% |
| Lumbee | 99.9 /100 | #43 | Exceptional 98.5% |
| Northern Europeans | 99.9 /100 | #44 | Exceptional 98.5% |
| Belgians | 99.9 /100 | #45 | Exceptional 98.5% |
| Hungarians | 99.9 /100 | #46 | Exceptional 98.5% |
| Czechoslovakians | 99.8 /100 | #47 | Exceptional 98.4% |
| Ottawa | 99.8 /100 | #48 | Exceptional 98.4% |
| Kiowa | 99.8 /100 | #49 | Exceptional 98.4% |
| Whites/Caucasians | 99.8 /100 | #50 | Exceptional 98.4% |