Yakama vs Okinawan 3rd Grade
COMPARE
Yakama
Okinawan
3rd Grade
3rd Grade Comparison
Yakama
Okinawans
95.9%
3RD GRADE
0.0/ 100
METRIC RATING
339th/ 347
METRIC RANK
98.0%
3RD GRADE
95.2/ 100
METRIC RATING
115th/ 347
METRIC RANK
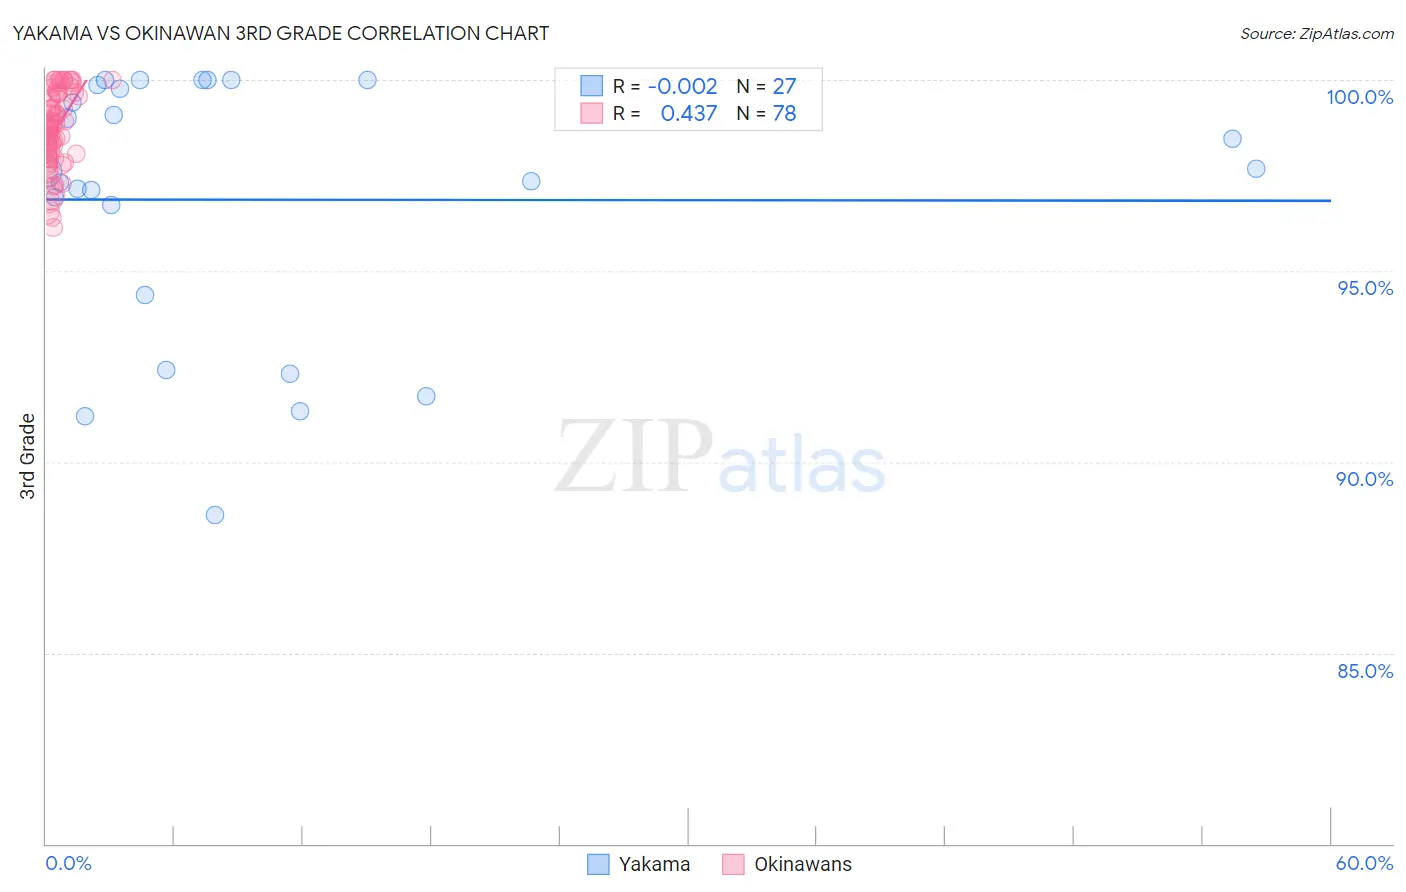
Yakama vs Okinawan 3rd Grade Correlation Chart
The statistical analysis conducted on geographies consisting of 19,923,144 people shows no correlation between the proportion of Yakama and percentage of population with at least 3rd grade education in the United States with a correlation coefficient (R) of -0.002 and weighted average of 95.9%. Similarly, the statistical analysis conducted on geographies consisting of 73,744,614 people shows a moderate positive correlation between the proportion of Okinawans and percentage of population with at least 3rd grade education in the United States with a correlation coefficient (R) of 0.437 and weighted average of 98.0%, a difference of 2.1%.
3rd Grade Correlation Summary
| Measurement | Yakama | Okinawan |
| Minimum | 88.6% | 96.2% |
| Maximum | 100.0% | 100.0% |
| Range | 11.4% | 3.8% |
| Mean | 96.9% | 98.7% |
| Median | 97.6% | 98.8% |
| Interquartile 25% (IQ1) | 94.4% | 98.1% |
| Interquartile 75% (IQ3) | 99.9% | 99.6% |
| Interquartile Range (IQR) | 5.5% | 1.5% |
| Standard Deviation (Sample) | 3.4% | 0.97% |
| Standard Deviation (Population) | 3.3% | 0.97% |
Similar Demographics by 3rd Grade
Demographics Similar to Yakama by 3rd Grade
In terms of 3rd grade, the demographic groups most similar to Yakama are Guatemalan (96.0%, a difference of 0.030%), Nepalese (95.9%, a difference of 0.080%), Immigrants from Central America (95.8%, a difference of 0.13%), Immigrants from Guatemala (95.8%, a difference of 0.13%), and Central American (96.1%, a difference of 0.15%).
| Demographics | Rating | Rank | 3rd Grade |
| Mexicans | 0.0 /100 | #332 | Tragic 96.2% |
| Immigrants | Fiji | 0.0 /100 | #333 | Tragic 96.2% |
| Immigrants | Cambodia | 0.0 /100 | #334 | Tragic 96.2% |
| Immigrants | Dominican Republic | 0.0 /100 | #335 | Tragic 96.2% |
| Immigrants | Cabo Verde | 0.0 /100 | #336 | Tragic 96.2% |
| Central Americans | 0.0 /100 | #337 | Tragic 96.1% |
| Guatemalans | 0.0 /100 | #338 | Tragic 96.0% |
| Yakama | 0.0 /100 | #339 | Tragic 95.9% |
| Nepalese | 0.0 /100 | #340 | Tragic 95.9% |
| Immigrants | Central America | 0.0 /100 | #341 | Tragic 95.8% |
| Immigrants | Guatemala | 0.0 /100 | #342 | Tragic 95.8% |
| Immigrants | Mexico | 0.0 /100 | #343 | Tragic 95.8% |
| Salvadorans | 0.0 /100 | #344 | Tragic 95.7% |
| Immigrants | Yemen | 0.0 /100 | #345 | Tragic 95.6% |
| Immigrants | El Salvador | 0.0 /100 | #346 | Tragic 95.5% |
Demographics Similar to Okinawans by 3rd Grade
In terms of 3rd grade, the demographic groups most similar to Okinawans are Thai (98.0%, a difference of 0.0%), Menominee (98.0%, a difference of 0.0%), Immigrants from Norway (98.0%, a difference of 0.0%), Immigrants from France (98.0%, a difference of 0.0%), and Iranian (98.0%, a difference of 0.010%).
| Demographics | Rating | Rank | 3rd Grade |
| Immigrants | Singapore | 96.7 /100 | #108 | Exceptional 98.0% |
| Pima | 96.7 /100 | #109 | Exceptional 98.0% |
| Immigrants | Switzerland | 96.6 /100 | #110 | Exceptional 98.0% |
| Basques | 96.5 /100 | #111 | Exceptional 98.0% |
| Immigrants | Latvia | 96.0 /100 | #112 | Exceptional 98.0% |
| Thais | 95.5 /100 | #113 | Exceptional 98.0% |
| Menominee | 95.4 /100 | #114 | Exceptional 98.0% |
| Okinawans | 95.2 /100 | #115 | Exceptional 98.0% |
| Immigrants | Norway | 95.2 /100 | #116 | Exceptional 98.0% |
| Immigrants | France | 95.1 /100 | #117 | Exceptional 98.0% |
| Iranians | 94.9 /100 | #118 | Exceptional 98.0% |
| Spanish | 94.8 /100 | #119 | Exceptional 98.0% |
| Immigrants | Croatia | 94.4 /100 | #120 | Exceptional 98.0% |
| Iroquois | 94.1 /100 | #121 | Exceptional 98.0% |
| Lebanese | 94.1 /100 | #122 | Exceptional 98.0% |