Macedonian vs Immigrants from Mexico 3rd Grade
COMPARE
Macedonian
Immigrants from Mexico
3rd Grade
3rd Grade Comparison
Macedonians
Immigrants from Mexico
98.1%
3RD GRADE
99.1/ 100
METRIC RATING
80th/ 347
METRIC RANK
95.8%
3RD GRADE
0.0/ 100
METRIC RATING
343rd/ 347
METRIC RANK
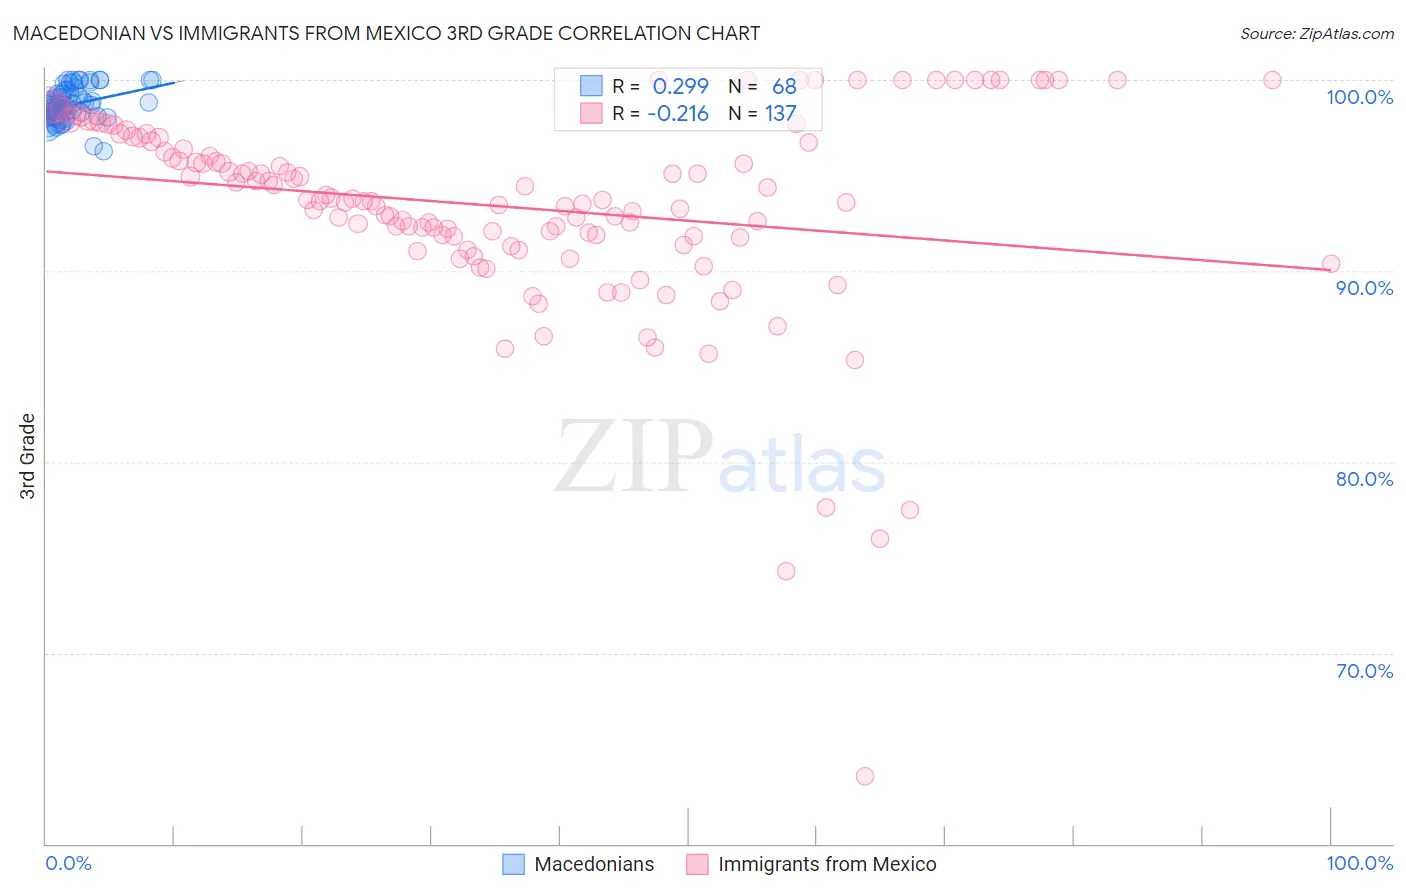
Macedonian vs Immigrants from Mexico 3rd Grade Correlation Chart
The statistical analysis conducted on geographies consisting of 132,592,860 people shows a weak positive correlation between the proportion of Macedonians and percentage of population with at least 3rd grade education in the United States with a correlation coefficient (R) of 0.299 and weighted average of 98.1%. Similarly, the statistical analysis conducted on geographies consisting of 513,767,657 people shows a weak negative correlation between the proportion of Immigrants from Mexico and percentage of population with at least 3rd grade education in the United States with a correlation coefficient (R) of -0.216 and weighted average of 95.8%, a difference of 2.5%.
3rd Grade Correlation Summary
| Measurement | Macedonian | Immigrants from Mexico |
| Minimum | 96.3% | 63.5% |
| Maximum | 100.0% | 100.0% |
| Range | 3.7% | 36.5% |
| Mean | 98.7% | 93.4% |
| Median | 98.7% | 93.7% |
| Interquartile 25% (IQ1) | 98.1% | 91.8% |
| Interquartile 75% (IQ3) | 99.3% | 96.9% |
| Interquartile Range (IQR) | 1.2% | 5.1% |
| Standard Deviation (Sample) | 0.86% | 5.4% |
| Standard Deviation (Population) | 0.85% | 5.3% |
Similar Demographics by 3rd Grade
Demographics Similar to Macedonians by 3rd Grade
In terms of 3rd grade, the demographic groups most similar to Macedonians are Immigrants from Belgium (98.1%, a difference of 0.0%), Icelander (98.1%, a difference of 0.0%), Immigrants from Lithuania (98.2%, a difference of 0.010%), Osage (98.2%, a difference of 0.010%), and Shoshone (98.1%, a difference of 0.010%).
| Demographics | Rating | Rank | 3rd Grade |
| Cheyenne | 99.3 /100 | #73 | Exceptional 98.2% |
| Immigrants | Netherlands | 99.3 /100 | #74 | Exceptional 98.2% |
| Cherokee | 99.3 /100 | #75 | Exceptional 98.2% |
| Immigrants | England | 99.2 /100 | #76 | Exceptional 98.2% |
| Immigrants | Lithuania | 99.2 /100 | #77 | Exceptional 98.2% |
| Osage | 99.2 /100 | #78 | Exceptional 98.2% |
| Immigrants | Belgium | 99.1 /100 | #79 | Exceptional 98.1% |
| Macedonians | 99.1 /100 | #80 | Exceptional 98.1% |
| Icelanders | 99.1 /100 | #81 | Exceptional 98.1% |
| Shoshone | 99.0 /100 | #82 | Exceptional 98.1% |
| Ukrainians | 98.9 /100 | #83 | Exceptional 98.1% |
| Immigrants | Sweden | 98.9 /100 | #84 | Exceptional 98.1% |
| Immigrants | Australia | 98.9 /100 | #85 | Exceptional 98.1% |
| Potawatomi | 98.9 /100 | #86 | Exceptional 98.1% |
| Immigrants | Denmark | 98.8 /100 | #87 | Exceptional 98.1% |
Demographics Similar to Immigrants from Mexico by 3rd Grade
In terms of 3rd grade, the demographic groups most similar to Immigrants from Mexico are Immigrants from Central America (95.8%, a difference of 0.040%), Immigrants from Guatemala (95.8%, a difference of 0.040%), Nepalese (95.9%, a difference of 0.090%), Salvadoran (95.7%, a difference of 0.11%), and Yakama (95.9%, a difference of 0.17%).
| Demographics | Rating | Rank | 3rd Grade |
| Immigrants | Fiji | 0.0 /100 | #333 | Tragic 96.2% |
| Immigrants | Cambodia | 0.0 /100 | #334 | Tragic 96.2% |
| Immigrants | Dominican Republic | 0.0 /100 | #335 | Tragic 96.2% |
| Immigrants | Cabo Verde | 0.0 /100 | #336 | Tragic 96.2% |
| Central Americans | 0.0 /100 | #337 | Tragic 96.1% |
| Guatemalans | 0.0 /100 | #338 | Tragic 96.0% |
| Yakama | 0.0 /100 | #339 | Tragic 95.9% |
| Nepalese | 0.0 /100 | #340 | Tragic 95.9% |
| Immigrants | Central America | 0.0 /100 | #341 | Tragic 95.8% |
| Immigrants | Guatemala | 0.0 /100 | #342 | Tragic 95.8% |
| Immigrants | Mexico | 0.0 /100 | #343 | Tragic 95.8% |
| Salvadorans | 0.0 /100 | #344 | Tragic 95.7% |
| Immigrants | Yemen | 0.0 /100 | #345 | Tragic 95.6% |
| Immigrants | El Salvador | 0.0 /100 | #346 | Tragic 95.5% |
| Spanish American Indians | 0.0 /100 | #347 | Tragic 95.3% |