White/Caucasian vs Slovak Unemployment Among Ages 25 to 29 years
COMPARE
White/Caucasian
Slovak
Unemployment Among Ages 25 to 29 years
Unemployment Among Ages 25 to 29 years Comparison
Whites/Caucasians
Slovaks
6.9%
UNEMPLOYMENT AMONG AGES 25 TO 29 YEARS
10.6/ 100
METRIC RATING
219th/ 347
METRIC RANK
6.8%
UNEMPLOYMENT AMONG AGES 25 TO 29 YEARS
14.3/ 100
METRIC RATING
216th/ 347
METRIC RANK
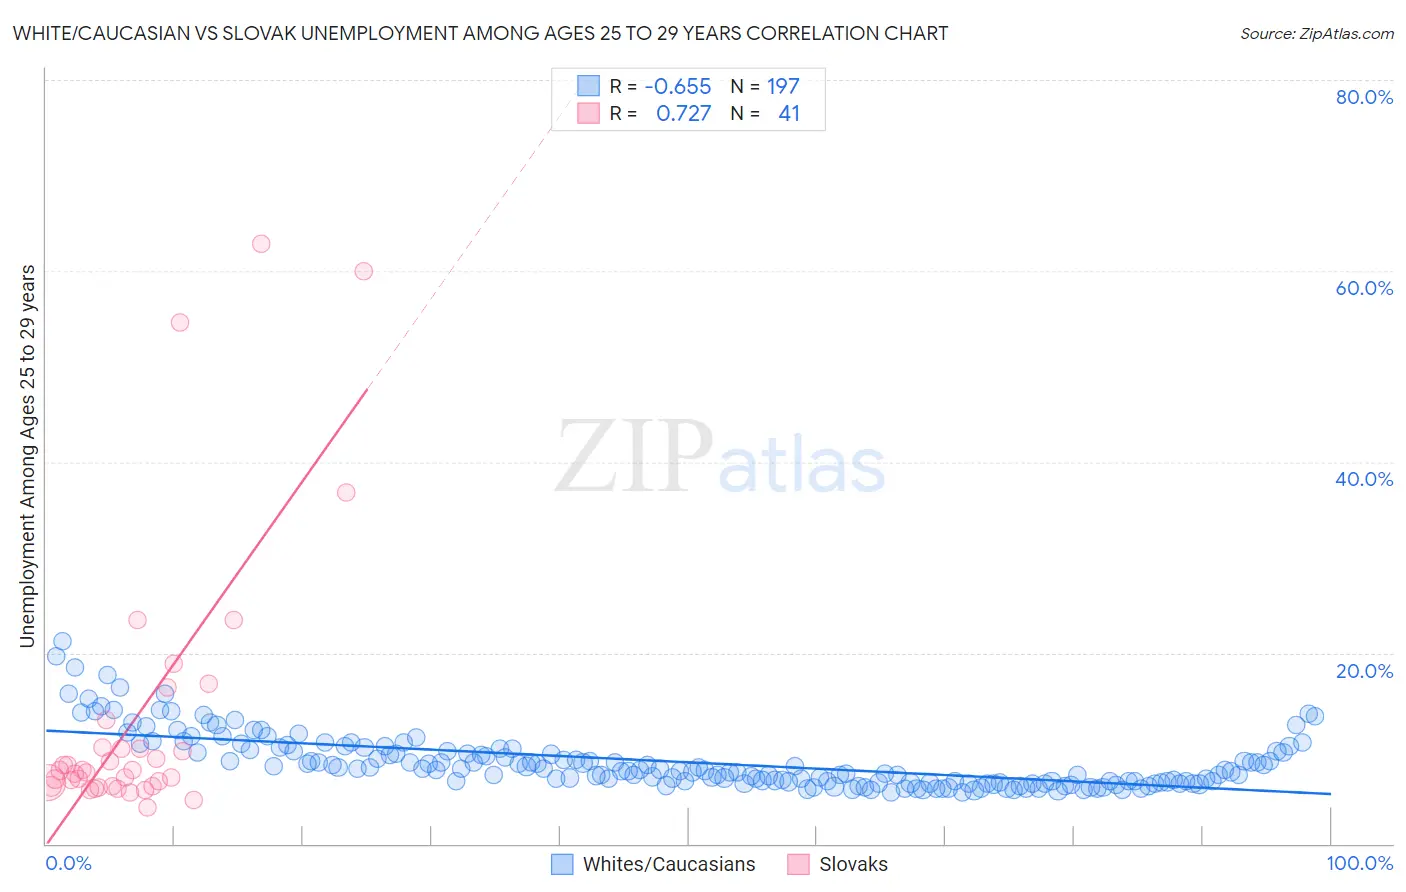
White/Caucasian vs Slovak Unemployment Among Ages 25 to 29 years Correlation Chart
The statistical analysis conducted on geographies consisting of 513,309,764 people shows a significant negative correlation between the proportion of Whites/Caucasians and unemployment rate among population between the ages 25 and 29 in the United States with a correlation coefficient (R) of -0.655 and weighted average of 6.9%. Similarly, the statistical analysis conducted on geographies consisting of 372,100,083 people shows a strong positive correlation between the proportion of Slovaks and unemployment rate among population between the ages 25 and 29 in the United States with a correlation coefficient (R) of 0.727 and weighted average of 6.8%, a difference of 0.51%.
Unemployment Among Ages 25 to 29 years Correlation Summary
| Measurement | White/Caucasian | Slovak |
| Minimum | 5.3% | 3.8% |
| Maximum | 21.2% | 62.9% |
| Range | 15.9% | 59.1% |
| Mean | 8.5% | 13.3% |
| Median | 7.7% | 7.7% |
| Interquartile 25% (IQ1) | 6.5% | 6.0% |
| Interquartile 75% (IQ3) | 9.8% | 11.5% |
| Interquartile Range (IQR) | 3.3% | 5.5% |
| Standard Deviation (Sample) | 2.9% | 14.5% |
| Standard Deviation (Population) | 2.9% | 14.3% |
Demographics Similar to Whites/Caucasians and Slovaks by Unemployment Among Ages 25 to 29 years
In terms of unemployment among ages 25 to 29 years, the demographic groups most similar to Whites/Caucasians are French (6.9%, a difference of 0.010%), Israeli (6.9%, a difference of 0.13%), Immigrants from Austria (6.8%, a difference of 0.26%), Ute (6.8%, a difference of 0.40%), and Spaniard (6.9%, a difference of 0.52%). Similarly, the demographic groups most similar to Slovaks are Spanish (6.8%, a difference of 0.020%), Liberian (6.8%, a difference of 0.050%), Immigrants from Syria (6.8%, a difference of 0.10%), Ute (6.8%, a difference of 0.11%), and Immigrants from Cabo Verde (6.8%, a difference of 0.22%).
| Demographics | Rating | Rank | Unemployment Among Ages 25 to 29 years |
| Immigrants | Denmark | 19.0 /100 | #207 | Poor 6.8% |
| Immigrants | Germany | 18.8 /100 | #208 | Poor 6.8% |
| Hawaiians | 17.1 /100 | #209 | Poor 6.8% |
| Canadians | 16.9 /100 | #210 | Poor 6.8% |
| Immigrants | Philippines | 16.7 /100 | #211 | Poor 6.8% |
| Immigrants | Cabo Verde | 16.2 /100 | #212 | Poor 6.8% |
| Immigrants | Syria | 15.1 /100 | #213 | Poor 6.8% |
| Liberians | 14.7 /100 | #214 | Poor 6.8% |
| Spanish | 14.4 /100 | #215 | Poor 6.8% |
| Slovaks | 14.3 /100 | #216 | Poor 6.8% |
| Ute | 13.4 /100 | #217 | Poor 6.8% |
| Immigrants | Austria | 12.3 /100 | #218 | Poor 6.8% |
| Whites/Caucasians | 10.6 /100 | #219 | Poor 6.9% |
| French | 10.5 /100 | #220 | Poor 6.9% |
| Israelis | 9.8 /100 | #221 | Tragic 6.9% |
| Spaniards | 7.7 /100 | #222 | Tragic 6.9% |
| Celtics | 7.6 /100 | #223 | Tragic 6.9% |
| Immigrants | Immigrants | 6.2 /100 | #224 | Tragic 6.9% |
| Japanese | 5.4 /100 | #225 | Tragic 6.9% |
| Immigrants | Liberia | 4.8 /100 | #226 | Tragic 7.0% |
| Salvadorans | 4.4 /100 | #227 | Tragic 7.0% |