White/Caucasian vs Immigrants from Guatemala Associate's Degree
COMPARE
White/Caucasian
Immigrants from Guatemala
Associate's Degree
Associate's Degree Comparison
Whites/Caucasians
Immigrants from Guatemala
44.2%
ASSOCIATE'S DEGREE
7.5/ 100
METRIC RATING
219th/ 347
METRIC RANK
38.1%
ASSOCIATE'S DEGREE
0.0/ 100
METRIC RATING
309th/ 347
METRIC RANK
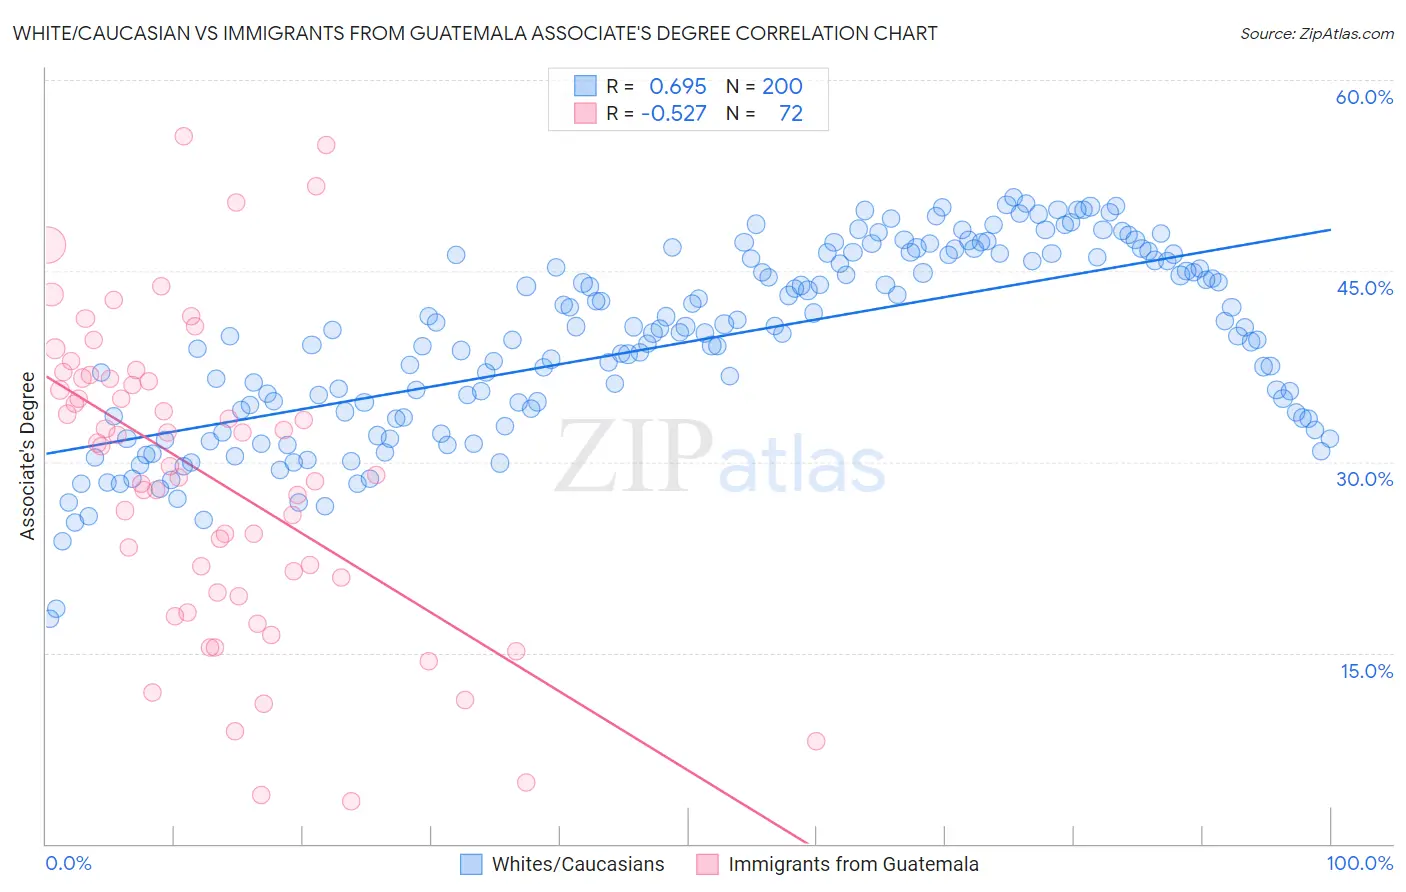
White/Caucasian vs Immigrants from Guatemala Associate's Degree Correlation Chart
The statistical analysis conducted on geographies consisting of 584,984,374 people shows a significant positive correlation between the proportion of Whites/Caucasians and percentage of population with at least associate's degree education in the United States with a correlation coefficient (R) of 0.695 and weighted average of 44.2%. Similarly, the statistical analysis conducted on geographies consisting of 377,269,409 people shows a substantial negative correlation between the proportion of Immigrants from Guatemala and percentage of population with at least associate's degree education in the United States with a correlation coefficient (R) of -0.527 and weighted average of 38.1%, a difference of 15.8%.
Associate's Degree Correlation Summary
| Measurement | White/Caucasian | Immigrants from Guatemala |
| Minimum | 17.7% | 3.3% |
| Maximum | 50.8% | 55.6% |
| Range | 33.1% | 52.2% |
| Mean | 39.4% | 28.9% |
| Median | 40.2% | 30.4% |
| Interquartile 25% (IQ1) | 33.5% | 20.3% |
| Interquartile 75% (IQ3) | 46.2% | 36.5% |
| Interquartile Range (IQR) | 12.6% | 16.2% |
| Standard Deviation (Sample) | 7.3% | 12.0% |
| Standard Deviation (Population) | 7.3% | 11.9% |
Similar Demographics by Associate's Degree
Demographics Similar to Whites/Caucasians by Associate's Degree
In terms of associate's degree, the demographic groups most similar to Whites/Caucasians are Portuguese (44.1%, a difference of 0.070%), Immigrants from Western Africa (44.1%, a difference of 0.27%), Spanish (44.4%, a difference of 0.48%), Barbadian (43.9%, a difference of 0.54%), and Subsaharan African (43.9%, a difference of 0.64%).
| Demographics | Rating | Rank | Associate's Degree |
| French Canadians | 15.0 /100 | #212 | Poor 44.9% |
| Immigrants | Ghana | 14.2 /100 | #213 | Poor 44.8% |
| Immigrants | Middle Africa | 12.7 /100 | #214 | Poor 44.7% |
| Immigrants | Panama | 12.4 /100 | #215 | Poor 44.7% |
| Immigrants | Nigeria | 11.4 /100 | #216 | Poor 44.6% |
| Immigrants | Immigrants | 10.5 /100 | #217 | Poor 44.5% |
| Spanish | 9.4 /100 | #218 | Tragic 44.4% |
| Whites/Caucasians | 7.5 /100 | #219 | Tragic 44.2% |
| Portuguese | 7.2 /100 | #220 | Tragic 44.1% |
| Immigrants | Western Africa | 6.6 /100 | #221 | Tragic 44.1% |
| Barbadians | 5.8 /100 | #222 | Tragic 43.9% |
| Sub-Saharan Africans | 5.5 /100 | #223 | Tragic 43.9% |
| West Indians | 5.2 /100 | #224 | Tragic 43.8% |
| Guamanians/Chamorros | 4.8 /100 | #225 | Tragic 43.8% |
| Immigrants | Burma/Myanmar | 4.3 /100 | #226 | Tragic 43.7% |
Demographics Similar to Immigrants from Guatemala by Associate's Degree
In terms of associate's degree, the demographic groups most similar to Immigrants from Guatemala are Mexican American Indian (38.2%, a difference of 0.040%), Immigrants from Dominican Republic (37.9%, a difference of 0.62%), Immigrants from El Salvador (38.4%, a difference of 0.71%), Immigrants from Latin America (37.9%, a difference of 0.73%), and Shoshone (38.4%, a difference of 0.75%).
| Demographics | Rating | Rank | Associate's Degree |
| Colville | 0.0 /100 | #302 | Tragic 38.5% |
| Guatemalans | 0.0 /100 | #303 | Tragic 38.5% |
| Sioux | 0.0 /100 | #304 | Tragic 38.5% |
| Immigrants | Honduras | 0.0 /100 | #305 | Tragic 38.5% |
| Shoshone | 0.0 /100 | #306 | Tragic 38.4% |
| Immigrants | El Salvador | 0.0 /100 | #307 | Tragic 38.4% |
| Mexican American Indians | 0.0 /100 | #308 | Tragic 38.2% |
| Immigrants | Guatemala | 0.0 /100 | #309 | Tragic 38.1% |
| Immigrants | Dominican Republic | 0.0 /100 | #310 | Tragic 37.9% |
| Immigrants | Latin America | 0.0 /100 | #311 | Tragic 37.9% |
| Choctaw | 0.0 /100 | #312 | Tragic 37.8% |
| Hispanics or Latinos | 0.0 /100 | #313 | Tragic 37.7% |
| Seminole | 0.0 /100 | #314 | Tragic 37.7% |
| Creek | 0.0 /100 | #315 | Tragic 37.6% |
| Crow | 0.0 /100 | #316 | Tragic 37.6% |