Immigrants from Colombia vs Immigrants from Spain Bachelor's Degree
COMPARE
Immigrants from Colombia
Immigrants from Spain
Bachelor's Degree
Bachelor's Degree Comparison
Immigrants from Colombia
Immigrants from Spain
37.7%
BACHELOR'S DEGREE
45.4/ 100
METRIC RATING
179th/ 347
METRIC RANK
44.3%
BACHELOR'S DEGREE
99.9/ 100
METRIC RATING
52nd/ 347
METRIC RANK
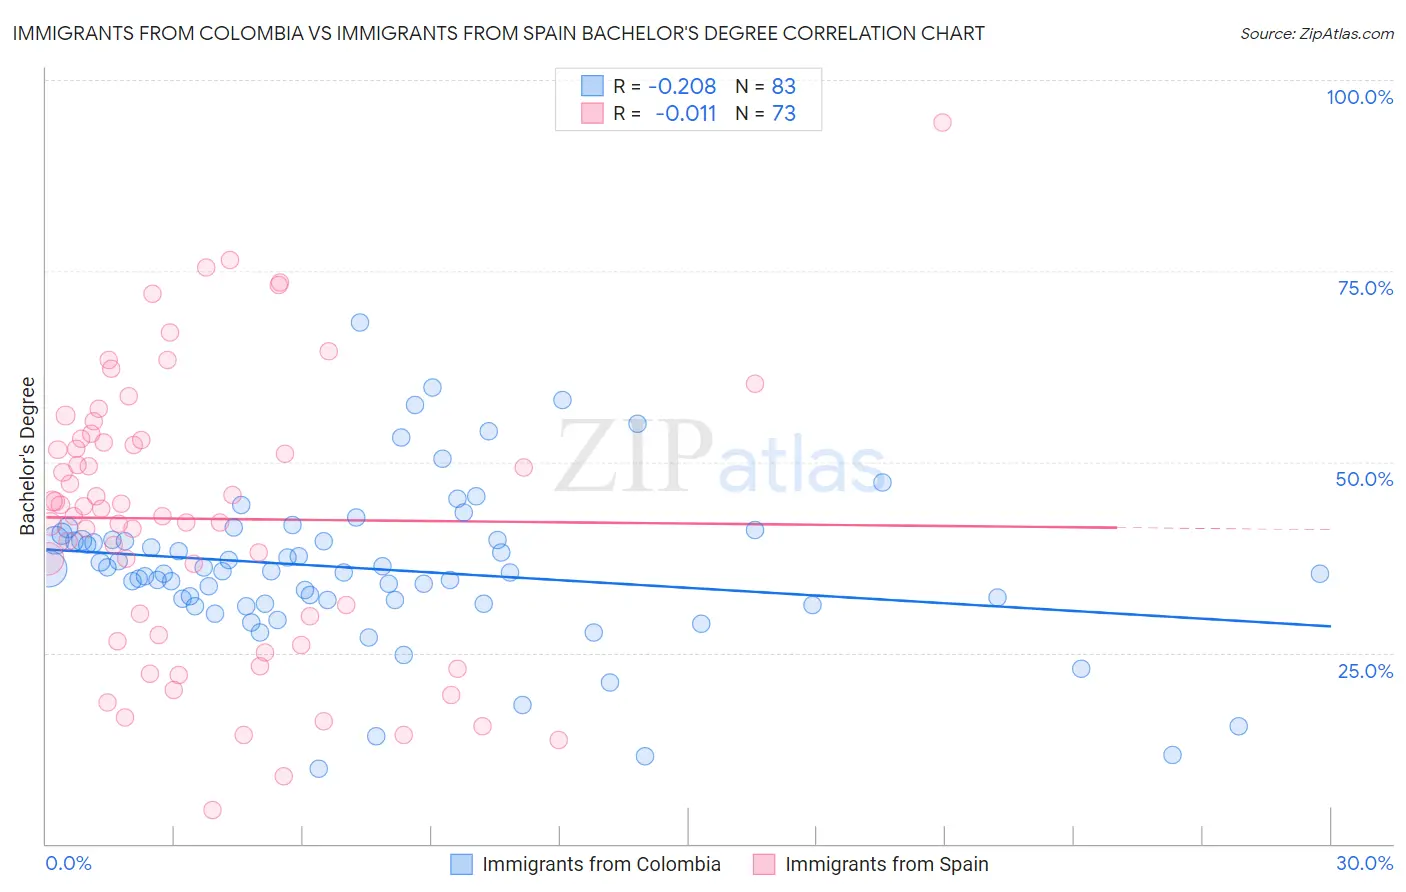
Immigrants from Colombia vs Immigrants from Spain Bachelor's Degree Correlation Chart
The statistical analysis conducted on geographies consisting of 378,673,496 people shows a weak negative correlation between the proportion of Immigrants from Colombia and percentage of population with at least bachelor's degree education in the United States with a correlation coefficient (R) of -0.208 and weighted average of 37.7%. Similarly, the statistical analysis conducted on geographies consisting of 239,678,363 people shows no correlation between the proportion of Immigrants from Spain and percentage of population with at least bachelor's degree education in the United States with a correlation coefficient (R) of -0.011 and weighted average of 44.3%, a difference of 17.7%.
Bachelor's Degree Correlation Summary
| Measurement | Immigrants from Colombia | Immigrants from Spain |
| Minimum | 9.8% | 4.4% |
| Maximum | 68.2% | 94.4% |
| Range | 58.4% | 90.0% |
| Mean | 36.0% | 42.5% |
| Median | 35.7% | 43.9% |
| Interquartile 25% (IQ1) | 31.5% | 26.9% |
| Interquartile 75% (IQ3) | 39.8% | 52.9% |
| Interquartile Range (IQR) | 8.3% | 26.1% |
| Standard Deviation (Sample) | 10.3% | 18.3% |
| Standard Deviation (Population) | 10.3% | 18.2% |
Similar Demographics by Bachelor's Degree
Demographics Similar to Immigrants from Colombia by Bachelor's Degree
In terms of bachelor's degree, the demographic groups most similar to Immigrants from Colombia are Irish (37.6%, a difference of 0.11%), Immigrants from Cameroon (37.7%, a difference of 0.13%), Immigrants from Senegal (37.6%, a difference of 0.16%), Basque (37.7%, a difference of 0.19%), and Immigrants from Bosnia and Herzegovina (37.6%, a difference of 0.20%).
| Demographics | Rating | Rank | Bachelor's Degree |
| Immigrants | Somalia | 52.8 /100 | #172 | Average 37.9% |
| Immigrants | Iraq | 52.5 /100 | #173 | Average 37.9% |
| Immigrants | Bangladesh | 50.0 /100 | #174 | Average 37.8% |
| Immigrants | Uruguay | 48.3 /100 | #175 | Average 37.8% |
| Costa Ricans | 47.6 /100 | #176 | Average 37.7% |
| Basques | 47.4 /100 | #177 | Average 37.7% |
| Immigrants | Cameroon | 46.8 /100 | #178 | Average 37.7% |
| Immigrants | Colombia | 45.4 /100 | #179 | Average 37.7% |
| Irish | 44.3 /100 | #180 | Average 37.6% |
| Immigrants | Senegal | 43.8 /100 | #181 | Average 37.6% |
| Immigrants | Bosnia and Herzegovina | 43.4 /100 | #182 | Average 37.6% |
| Senegalese | 42.2 /100 | #183 | Average 37.5% |
| Scandinavians | 41.7 /100 | #184 | Average 37.5% |
| Immigrants | Peru | 41.3 /100 | #185 | Average 37.5% |
| Norwegians | 40.4 /100 | #186 | Average 37.5% |
Demographics Similar to Immigrants from Spain by Bachelor's Degree
In terms of bachelor's degree, the demographic groups most similar to Immigrants from Spain are Immigrants from Asia (44.3%, a difference of 0.060%), Asian (44.4%, a difference of 0.18%), Immigrants from Austria (44.2%, a difference of 0.24%), Immigrants from Bolivia (44.2%, a difference of 0.25%), and Immigrants from Greece (44.5%, a difference of 0.32%).
| Demographics | Rating | Rank | Bachelor's Degree |
| Immigrants | Kuwait | 99.9 /100 | #45 | Exceptional 44.6% |
| Immigrants | Bulgaria | 99.9 /100 | #46 | Exceptional 44.6% |
| Bolivians | 99.9 /100 | #47 | Exceptional 44.6% |
| Estonians | 99.9 /100 | #48 | Exceptional 44.6% |
| Immigrants | Norway | 99.9 /100 | #49 | Exceptional 44.5% |
| Immigrants | Greece | 99.9 /100 | #50 | Exceptional 44.5% |
| Asians | 99.9 /100 | #51 | Exceptional 44.4% |
| Immigrants | Spain | 99.9 /100 | #52 | Exceptional 44.3% |
| Immigrants | Asia | 99.9 /100 | #53 | Exceptional 44.3% |
| Immigrants | Austria | 99.9 /100 | #54 | Exceptional 44.2% |
| Immigrants | Bolivia | 99.9 /100 | #55 | Exceptional 44.2% |
| Immigrants | Serbia | 99.9 /100 | #56 | Exceptional 44.1% |
| Paraguayans | 99.9 /100 | #57 | Exceptional 44.0% |
| Immigrants | Czechoslovakia | 99.9 /100 | #58 | Exceptional 44.0% |
| Australians | 99.9 /100 | #59 | Exceptional 44.0% |