Bolivian vs Ute Master's Degree
COMPARE
Bolivian
Ute
Master's Degree
Master's Degree Comparison
Bolivians
Ute
19.3%
MASTER'S DEGREE
100.0/ 100
METRIC RATING
38th/ 347
METRIC RANK
11.7%
MASTER'S DEGREE
0.1/ 100
METRIC RATING
290th/ 347
METRIC RANK
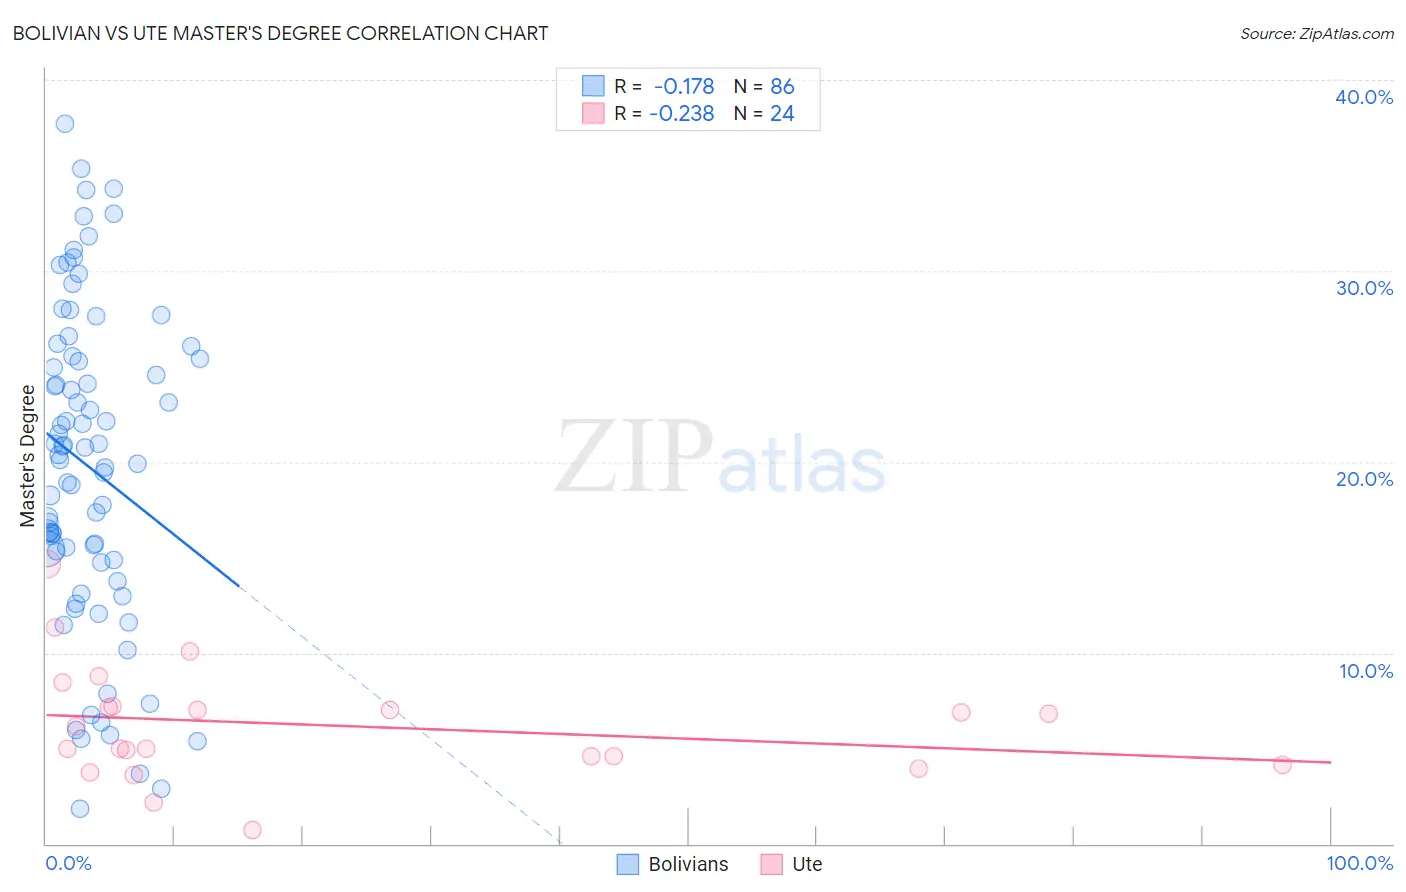
Bolivian vs Ute Master's Degree Correlation Chart
The statistical analysis conducted on geographies consisting of 184,652,139 people shows a poor negative correlation between the proportion of Bolivians and percentage of population with at least master's degree education in the United States with a correlation coefficient (R) of -0.178 and weighted average of 19.3%. Similarly, the statistical analysis conducted on geographies consisting of 55,657,479 people shows a weak negative correlation between the proportion of Ute and percentage of population with at least master's degree education in the United States with a correlation coefficient (R) of -0.238 and weighted average of 11.7%, a difference of 64.4%.
Master's Degree Correlation Summary
| Measurement | Bolivian | Ute |
| Minimum | 1.8% | 0.74% |
| Maximum | 37.7% | 14.6% |
| Range | 35.9% | 13.9% |
| Mean | 19.7% | 6.2% |
| Median | 20.2% | 5.6% |
| Interquartile 25% (IQ1) | 14.9% | 4.4% |
| Interquartile 75% (IQ3) | 25.4% | 7.2% |
| Interquartile Range (IQR) | 10.5% | 2.8% |
| Standard Deviation (Sample) | 8.3% | 3.0% |
| Standard Deviation (Population) | 8.3% | 2.9% |
Similar Demographics by Master's Degree
Demographics Similar to Bolivians by Master's Degree
In terms of master's degree, the demographic groups most similar to Bolivians are Immigrants from Spain (19.1%, a difference of 0.64%), Mongolian (19.4%, a difference of 0.69%), Immigrants from Russia (19.4%, a difference of 0.73%), Immigrants from Bolivia (19.1%, a difference of 0.77%), and Immigrants from Northern Europe (19.5%, a difference of 1.1%).
| Demographics | Rating | Rank | Master's Degree |
| Immigrants | Korea | 100.0 /100 | #31 | Exceptional 19.7% |
| Burmese | 100.0 /100 | #32 | Exceptional 19.7% |
| Russians | 100.0 /100 | #33 | Exceptional 19.5% |
| Immigrants | Denmark | 100.0 /100 | #34 | Exceptional 19.5% |
| Immigrants | Northern Europe | 100.0 /100 | #35 | Exceptional 19.5% |
| Immigrants | Russia | 100.0 /100 | #36 | Exceptional 19.4% |
| Mongolians | 100.0 /100 | #37 | Exceptional 19.4% |
| Bolivians | 100.0 /100 | #38 | Exceptional 19.3% |
| Immigrants | Spain | 100.0 /100 | #39 | Exceptional 19.1% |
| Immigrants | Bolivia | 100.0 /100 | #40 | Exceptional 19.1% |
| Immigrants | Latvia | 100.0 /100 | #41 | Exceptional 19.1% |
| Immigrants | Saudi Arabia | 100.0 /100 | #42 | Exceptional 19.0% |
| Immigrants | Greece | 100.0 /100 | #43 | Exceptional 19.0% |
| Immigrants | Malaysia | 100.0 /100 | #44 | Exceptional 18.9% |
| Immigrants | Belarus | 100.0 /100 | #45 | Exceptional 18.9% |
Demographics Similar to Ute by Master's Degree
In terms of master's degree, the demographic groups most similar to Ute are Guatemalan (11.7%, a difference of 0.24%), Immigrants from Honduras (11.8%, a difference of 0.32%), Immigrants from Haiti (11.8%, a difference of 0.49%), Colville (11.6%, a difference of 0.67%), and Aleut (11.8%, a difference of 0.69%).
| Demographics | Rating | Rank | Master's Degree |
| Hondurans | 0.2 /100 | #283 | Tragic 11.9% |
| Ottawa | 0.2 /100 | #284 | Tragic 11.9% |
| Immigrants | Nicaragua | 0.2 /100 | #285 | Tragic 11.8% |
| Aleuts | 0.1 /100 | #286 | Tragic 11.8% |
| Immigrants | Haiti | 0.1 /100 | #287 | Tragic 11.8% |
| Immigrants | Honduras | 0.1 /100 | #288 | Tragic 11.8% |
| Guatemalans | 0.1 /100 | #289 | Tragic 11.7% |
| Ute | 0.1 /100 | #290 | Tragic 11.7% |
| Colville | 0.1 /100 | #291 | Tragic 11.6% |
| Immigrants | Guatemala | 0.1 /100 | #292 | Tragic 11.6% |
| Alaska Natives | 0.1 /100 | #293 | Tragic 11.6% |
| Hawaiians | 0.1 /100 | #294 | Tragic 11.6% |
| Marshallese | 0.1 /100 | #295 | Tragic 11.6% |
| Alaskan Athabascans | 0.1 /100 | #296 | Tragic 11.6% |
| Immigrants | Yemen | 0.1 /100 | #297 | Tragic 11.6% |