West Indian vs Immigrants from North America No Schooling Completed
COMPARE
West Indian
Immigrants from North America
No Schooling Completed
No Schooling Completed Comparison
West Indians
Immigrants from North America
2.5%
NO SCHOOLING COMPLETED
0.4/ 100
METRIC RATING
265th/ 347
METRIC RANK
1.6%
NO SCHOOLING COMPLETED
99.8/ 100
METRIC RATING
56th/ 347
METRIC RANK
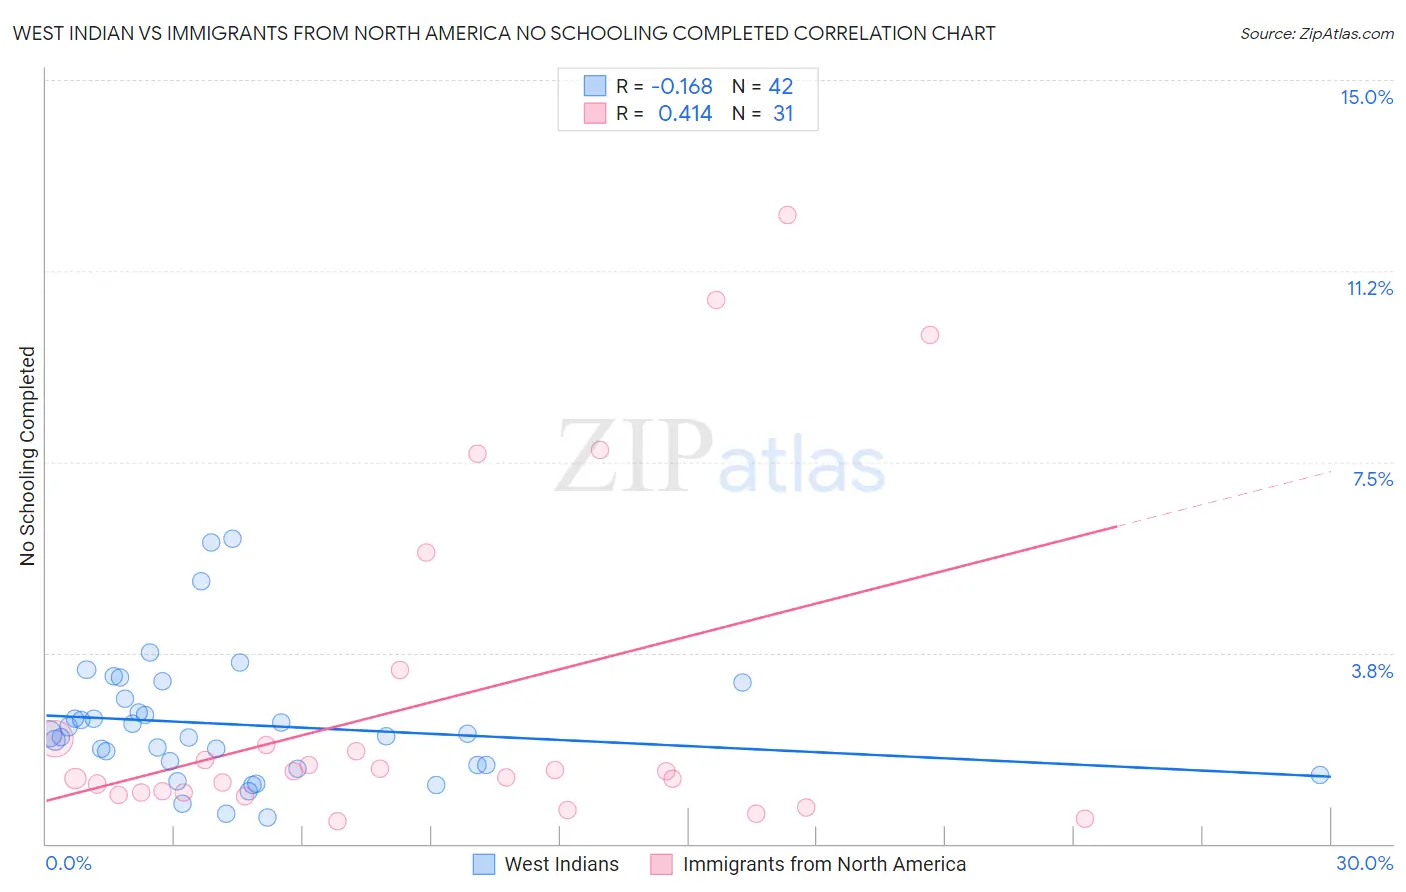
West Indian vs Immigrants from North America No Schooling Completed Correlation Chart
The statistical analysis conducted on geographies consisting of 253,089,115 people shows a poor negative correlation between the proportion of West Indians and percentage of population with no schooling in the United States with a correlation coefficient (R) of -0.168 and weighted average of 2.5%. Similarly, the statistical analysis conducted on geographies consisting of 454,496,769 people shows a moderate positive correlation between the proportion of Immigrants from North America and percentage of population with no schooling in the United States with a correlation coefficient (R) of 0.414 and weighted average of 1.6%, a difference of 51.0%.
No Schooling Completed Correlation Summary
| Measurement | West Indian | Immigrants from North America |
| Minimum | 0.51% | 0.45% |
| Maximum | 6.0% | 12.4% |
| Range | 5.5% | 11.9% |
| Mean | 2.3% | 2.8% |
| Median | 2.1% | 1.4% |
| Interquartile 25% (IQ1) | 1.6% | 1.00% |
| Interquartile 75% (IQ3) | 2.9% | 2.1% |
| Interquartile Range (IQR) | 1.3% | 1.1% |
| Standard Deviation (Sample) | 1.2% | 3.3% |
| Standard Deviation (Population) | 1.2% | 3.3% |
Similar Demographics by No Schooling Completed
Demographics Similar to West Indians by No Schooling Completed
In terms of no schooling completed, the demographic groups most similar to West Indians are Fijian (2.5%, a difference of 0.080%), Indian (Asian) (2.5%, a difference of 0.18%), Yuman (2.5%, a difference of 0.25%), Immigrants from Liberia (2.5%, a difference of 0.31%), and Immigrants from Sierra Leone (2.5%, a difference of 0.48%).
| Demographics | Rating | Rank | No Schooling Completed |
| Assyrians/Chaldeans/Syriacs | 0.6 /100 | #258 | Tragic 2.5% |
| Immigrants | Jamaica | 0.6 /100 | #259 | Tragic 2.5% |
| Immigrants | Ethiopia | 0.6 /100 | #260 | Tragic 2.5% |
| Armenians | 0.5 /100 | #261 | Tragic 2.5% |
| Immigrants | Sierra Leone | 0.5 /100 | #262 | Tragic 2.5% |
| Immigrants | Liberia | 0.4 /100 | #263 | Tragic 2.5% |
| Indians (Asian) | 0.4 /100 | #264 | Tragic 2.5% |
| West Indians | 0.4 /100 | #265 | Tragic 2.5% |
| Fijians | 0.4 /100 | #266 | Tragic 2.5% |
| Yuman | 0.4 /100 | #267 | Tragic 2.5% |
| Taiwanese | 0.3 /100 | #268 | Tragic 2.5% |
| Immigrants | Nigeria | 0.2 /100 | #269 | Tragic 2.5% |
| Immigrants | Peru | 0.2 /100 | #270 | Tragic 2.5% |
| Cubans | 0.2 /100 | #271 | Tragic 2.5% |
| Immigrants | Bolivia | 0.2 /100 | #272 | Tragic 2.5% |
Demographics Similar to Immigrants from North America by No Schooling Completed
In terms of no schooling completed, the demographic groups most similar to Immigrants from North America are Greek (1.6%, a difference of 0.0%), Crow (1.6%, a difference of 0.12%), Creek (1.6%, a difference of 0.15%), Immigrants from Canada (1.6%, a difference of 0.28%), and Austrian (1.6%, a difference of 0.31%).
| Demographics | Rating | Rank | No Schooling Completed |
| Whites/Caucasians | 99.9 /100 | #49 | Exceptional 1.6% |
| Celtics | 99.9 /100 | #50 | Exceptional 1.6% |
| Chippewa | 99.8 /100 | #51 | Exceptional 1.6% |
| Immigrants | Canada | 99.8 /100 | #52 | Exceptional 1.6% |
| Creek | 99.8 /100 | #53 | Exceptional 1.6% |
| Crow | 99.8 /100 | #54 | Exceptional 1.6% |
| Greeks | 99.8 /100 | #55 | Exceptional 1.6% |
| Immigrants | North America | 99.8 /100 | #56 | Exceptional 1.6% |
| Austrians | 99.8 /100 | #57 | Exceptional 1.6% |
| Kiowa | 99.8 /100 | #58 | Exceptional 1.6% |
| Slavs | 99.8 /100 | #59 | Exceptional 1.7% |
| Americans | 99.8 /100 | #60 | Exceptional 1.7% |
| Tsimshian | 99.8 /100 | #61 | Exceptional 1.7% |
| Immigrants | Northern Europe | 99.8 /100 | #62 | Exceptional 1.7% |
| Russians | 99.8 /100 | #63 | Exceptional 1.7% |