Welsh vs Immigrants from Uruguay 2nd Grade
COMPARE
Welsh
Immigrants from Uruguay
2nd Grade
2nd Grade Comparison
Welsh
Immigrants from Uruguay
98.5%
2ND GRADE
100.0/ 100
METRIC RATING
26th/ 347
METRIC RANK
97.6%
2ND GRADE
2.1/ 100
METRIC RATING
233rd/ 347
METRIC RANK
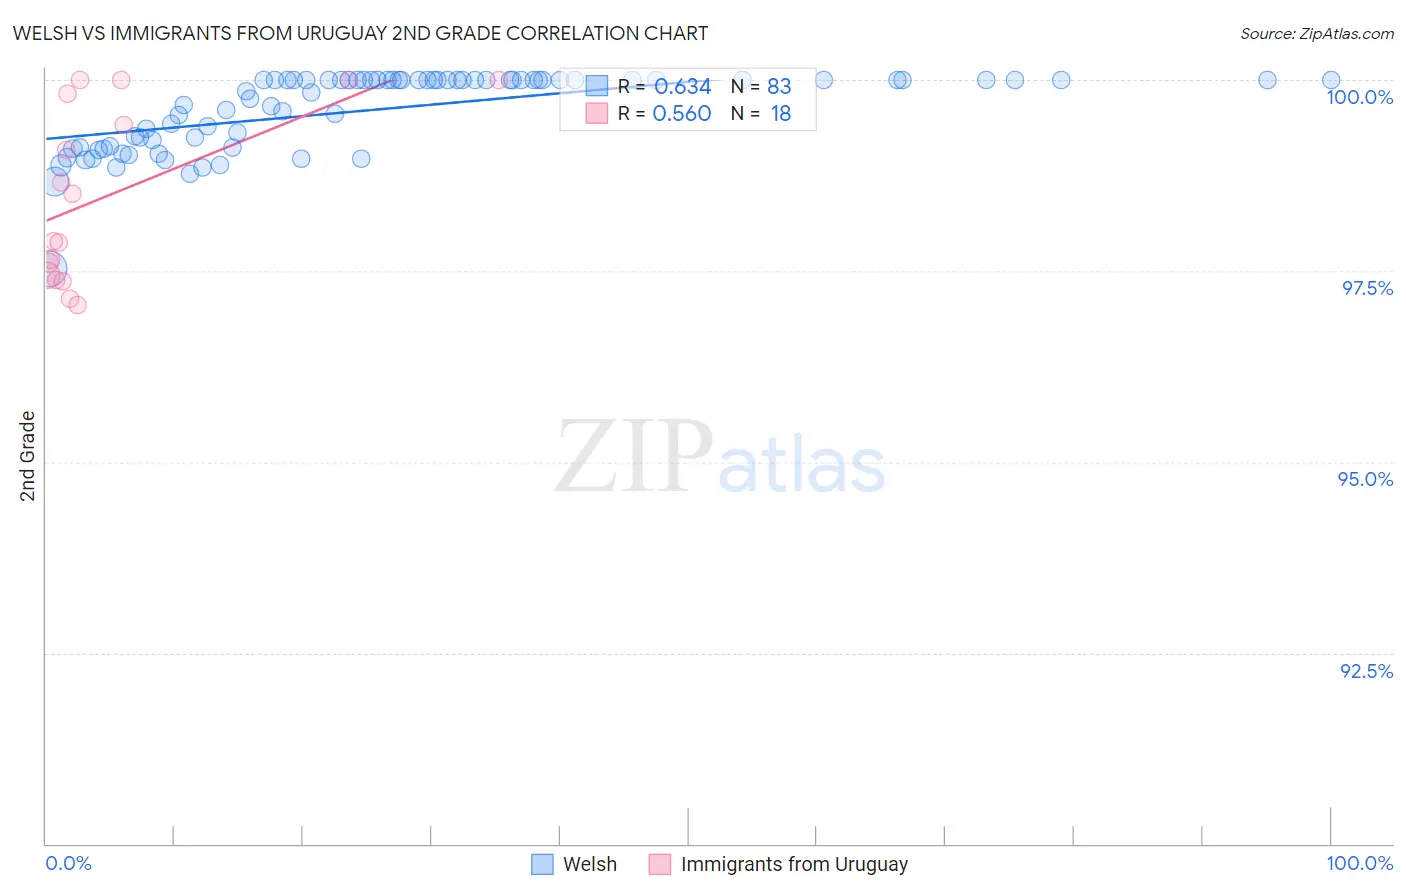
Welsh vs Immigrants from Uruguay 2nd Grade Correlation Chart
The statistical analysis conducted on geographies consisting of 528,593,932 people shows a significant positive correlation between the proportion of Welsh and percentage of population with at least 2nd grade education in the United States with a correlation coefficient (R) of 0.634 and weighted average of 98.5%. Similarly, the statistical analysis conducted on geographies consisting of 133,259,667 people shows a substantial positive correlation between the proportion of Immigrants from Uruguay and percentage of population with at least 2nd grade education in the United States with a correlation coefficient (R) of 0.560 and weighted average of 97.6%, a difference of 0.98%.
2nd Grade Correlation Summary
| Measurement | Welsh | Immigrants from Uruguay |
| Minimum | 97.5% | 97.1% |
| Maximum | 100.0% | 100.0% |
| Range | 2.5% | 2.9% |
| Mean | 99.6% | 98.5% |
| Median | 100.0% | 98.2% |
| Interquartile 25% (IQ1) | 99.1% | 97.4% |
| Interquartile 75% (IQ3) | 100.0% | 99.8% |
| Interquartile Range (IQR) | 0.88% | 2.4% |
| Standard Deviation (Sample) | 0.50% | 1.1% |
| Standard Deviation (Population) | 0.50% | 1.1% |
Similar Demographics by 2nd Grade
Demographics Similar to Welsh by 2nd Grade
In terms of 2nd grade, the demographic groups most similar to Welsh are Scotch-Irish (98.5%, a difference of 0.010%), Croatian (98.5%, a difference of 0.010%), Arapaho (98.5%, a difference of 0.010%), French (98.5%, a difference of 0.010%), and Finnish (98.5%, a difference of 0.020%).
| Demographics | Rating | Rank | 2nd Grade |
| Finns | 100.0 /100 | #19 | Exceptional 98.5% |
| Sioux | 100.0 /100 | #20 | Exceptional 98.5% |
| Lithuanians | 100.0 /100 | #21 | Exceptional 98.5% |
| Poles | 100.0 /100 | #22 | Exceptional 98.5% |
| Danes | 100.0 /100 | #23 | Exceptional 98.5% |
| Pennsylvania Germans | 100.0 /100 | #24 | Exceptional 98.5% |
| Scotch-Irish | 100.0 /100 | #25 | Exceptional 98.5% |
| Welsh | 100.0 /100 | #26 | Exceptional 98.5% |
| Croatians | 100.0 /100 | #27 | Exceptional 98.5% |
| Arapaho | 100.0 /100 | #28 | Exceptional 98.5% |
| French | 100.0 /100 | #29 | Exceptional 98.5% |
| Europeans | 100.0 /100 | #30 | Exceptional 98.5% |
| Czechs | 100.0 /100 | #31 | Exceptional 98.5% |
| French Canadians | 100.0 /100 | #32 | Exceptional 98.5% |
| Scandinavians | 100.0 /100 | #33 | Exceptional 98.5% |
Demographics Similar to Immigrants from Uruguay by 2nd Grade
In terms of 2nd grade, the demographic groups most similar to Immigrants from Uruguay are Immigrants from Western Asia (97.6%, a difference of 0.0%), Immigrants from Malaysia (97.6%, a difference of 0.0%), Immigrants from Pakistan (97.6%, a difference of 0.010%), Colombian (97.6%, a difference of 0.010%), and Nigerian (97.6%, a difference of 0.020%).
| Demographics | Rating | Rank | 2nd Grade |
| Immigrants | Syria | 4.0 /100 | #226 | Tragic 97.6% |
| Immigrants | Nepal | 4.0 /100 | #227 | Tragic 97.6% |
| Sub-Saharan Africans | 3.4 /100 | #228 | Tragic 97.6% |
| Immigrants | Costa Rica | 3.1 /100 | #229 | Tragic 97.6% |
| Senegalese | 3.1 /100 | #230 | Tragic 97.6% |
| Immigrants | Pakistan | 2.3 /100 | #231 | Tragic 97.6% |
| Immigrants | Western Asia | 2.1 /100 | #232 | Tragic 97.6% |
| Immigrants | Uruguay | 2.1 /100 | #233 | Tragic 97.6% |
| Immigrants | Malaysia | 2.0 /100 | #234 | Tragic 97.6% |
| Colombians | 1.9 /100 | #235 | Tragic 97.6% |
| Nigerians | 1.7 /100 | #236 | Tragic 97.6% |
| U.S. Virgin Islanders | 1.6 /100 | #237 | Tragic 97.6% |
| Immigrants | Eastern Asia | 1.6 /100 | #238 | Tragic 97.6% |
| Liberians | 1.6 /100 | #239 | Tragic 97.6% |
| Koreans | 1.5 /100 | #240 | Tragic 97.5% |