Welsh vs Immigrants from Iraq 10th Grade
COMPARE
Welsh
Immigrants from Iraq
10th Grade
10th Grade Comparison
Welsh
Immigrants from Iraq
95.5%
10TH GRADE
100.0/ 100
METRIC RATING
26th/ 347
METRIC RANK
93.8%
10TH GRADE
63.0/ 100
METRIC RATING
166th/ 347
METRIC RANK
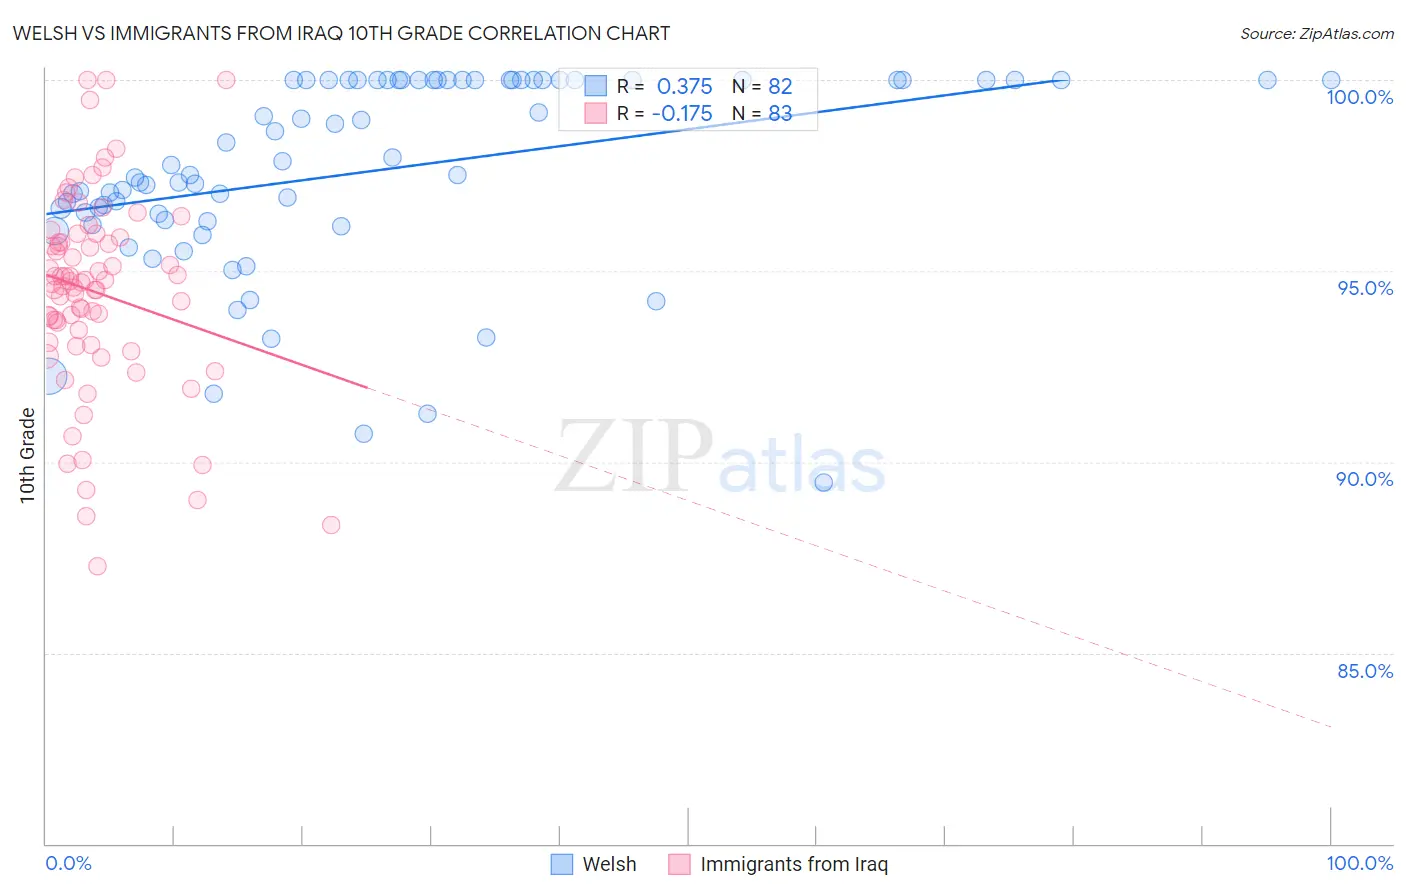
Welsh vs Immigrants from Iraq 10th Grade Correlation Chart
The statistical analysis conducted on geographies consisting of 528,594,177 people shows a mild positive correlation between the proportion of Welsh and percentage of population with at least 10th grade education in the United States with a correlation coefficient (R) of 0.375 and weighted average of 95.5%. Similarly, the statistical analysis conducted on geographies consisting of 194,632,332 people shows a poor negative correlation between the proportion of Immigrants from Iraq and percentage of population with at least 10th grade education in the United States with a correlation coefficient (R) of -0.175 and weighted average of 93.8%, a difference of 1.7%.
10th Grade Correlation Summary
| Measurement | Welsh | Immigrants from Iraq |
| Minimum | 89.5% | 87.3% |
| Maximum | 100.0% | 100.0% |
| Range | 10.5% | 12.7% |
| Mean | 97.6% | 94.4% |
| Median | 97.6% | 94.7% |
| Interquartile 25% (IQ1) | 96.3% | 93.1% |
| Interquartile 75% (IQ3) | 100.0% | 95.9% |
| Interquartile Range (IQR) | 3.7% | 2.8% |
| Standard Deviation (Sample) | 2.6% | 2.6% |
| Standard Deviation (Population) | 2.5% | 2.6% |
Similar Demographics by 10th Grade
Demographics Similar to Welsh by 10th Grade
In terms of 10th grade, the demographic groups most similar to Welsh are European (95.5%, a difference of 0.020%), Maltese (95.5%, a difference of 0.020%), Alaskan Athabascan (95.4%, a difference of 0.020%), Luxembourger (95.4%, a difference of 0.020%), and Czech (95.5%, a difference of 0.030%).
| Demographics | Rating | Rank | 10th Grade |
| Scandinavians | 100.0 /100 | #19 | Exceptional 95.6% |
| Chinese | 100.0 /100 | #20 | Exceptional 95.5% |
| Dutch | 100.0 /100 | #21 | Exceptional 95.5% |
| Eastern Europeans | 100.0 /100 | #22 | Exceptional 95.5% |
| Czechs | 100.0 /100 | #23 | Exceptional 95.5% |
| Europeans | 100.0 /100 | #24 | Exceptional 95.5% |
| Maltese | 100.0 /100 | #25 | Exceptional 95.5% |
| Welsh | 100.0 /100 | #26 | Exceptional 95.5% |
| Alaskan Athabascans | 100.0 /100 | #27 | Exceptional 95.4% |
| Luxembourgers | 100.0 /100 | #28 | Exceptional 95.4% |
| Bulgarians | 100.0 /100 | #29 | Exceptional 95.4% |
| Belgians | 100.0 /100 | #30 | Exceptional 95.4% |
| Iranians | 100.0 /100 | #31 | Exceptional 95.3% |
| Hungarians | 100.0 /100 | #32 | Exceptional 95.3% |
| French | 100.0 /100 | #33 | Exceptional 95.3% |
Demographics Similar to Immigrants from Iraq by 10th Grade
In terms of 10th grade, the demographic groups most similar to Immigrants from Iraq are Brazilian (93.8%, a difference of 0.010%), Immigrants from Egypt (93.8%, a difference of 0.010%), Alsatian (93.8%, a difference of 0.030%), Iraqi (93.9%, a difference of 0.050%), and Chilean (93.9%, a difference of 0.070%).
| Demographics | Rating | Rank | 10th Grade |
| Chileans | 70.2 /100 | #159 | Good 93.9% |
| Pakistanis | 70.1 /100 | #160 | Good 93.9% |
| Assyrians/Chaldeans/Syriacs | 69.7 /100 | #161 | Good 93.9% |
| Immigrants | Poland | 69.6 /100 | #162 | Good 93.9% |
| Venezuelans | 69.5 /100 | #163 | Good 93.9% |
| Iraqis | 68.1 /100 | #164 | Good 93.9% |
| Brazilians | 63.6 /100 | #165 | Good 93.8% |
| Immigrants | Iraq | 63.0 /100 | #166 | Good 93.8% |
| Immigrants | Egypt | 62.3 /100 | #167 | Good 93.8% |
| Alsatians | 59.4 /100 | #168 | Average 93.8% |
| Immigrants | Spain | 55.9 /100 | #169 | Average 93.8% |
| Immigrants | Venezuela | 53.9 /100 | #170 | Average 93.8% |
| Immigrants | Albania | 52.4 /100 | #171 | Average 93.8% |
| French American Indians | 50.9 /100 | #172 | Average 93.7% |
| Spaniards | 50.3 /100 | #173 | Average 93.7% |