Immigrants from Italy vs Immigrants from Greece 9th Grade
COMPARE
Immigrants from Italy
Immigrants from Greece
9th Grade
9th Grade Comparison
Immigrants from Italy
Immigrants from Greece
95.0%
9TH GRADE
66.6/ 100
METRIC RATING
160th/ 347
METRIC RANK
95.2%
9TH GRADE
84.6/ 100
METRIC RATING
142nd/ 347
METRIC RANK
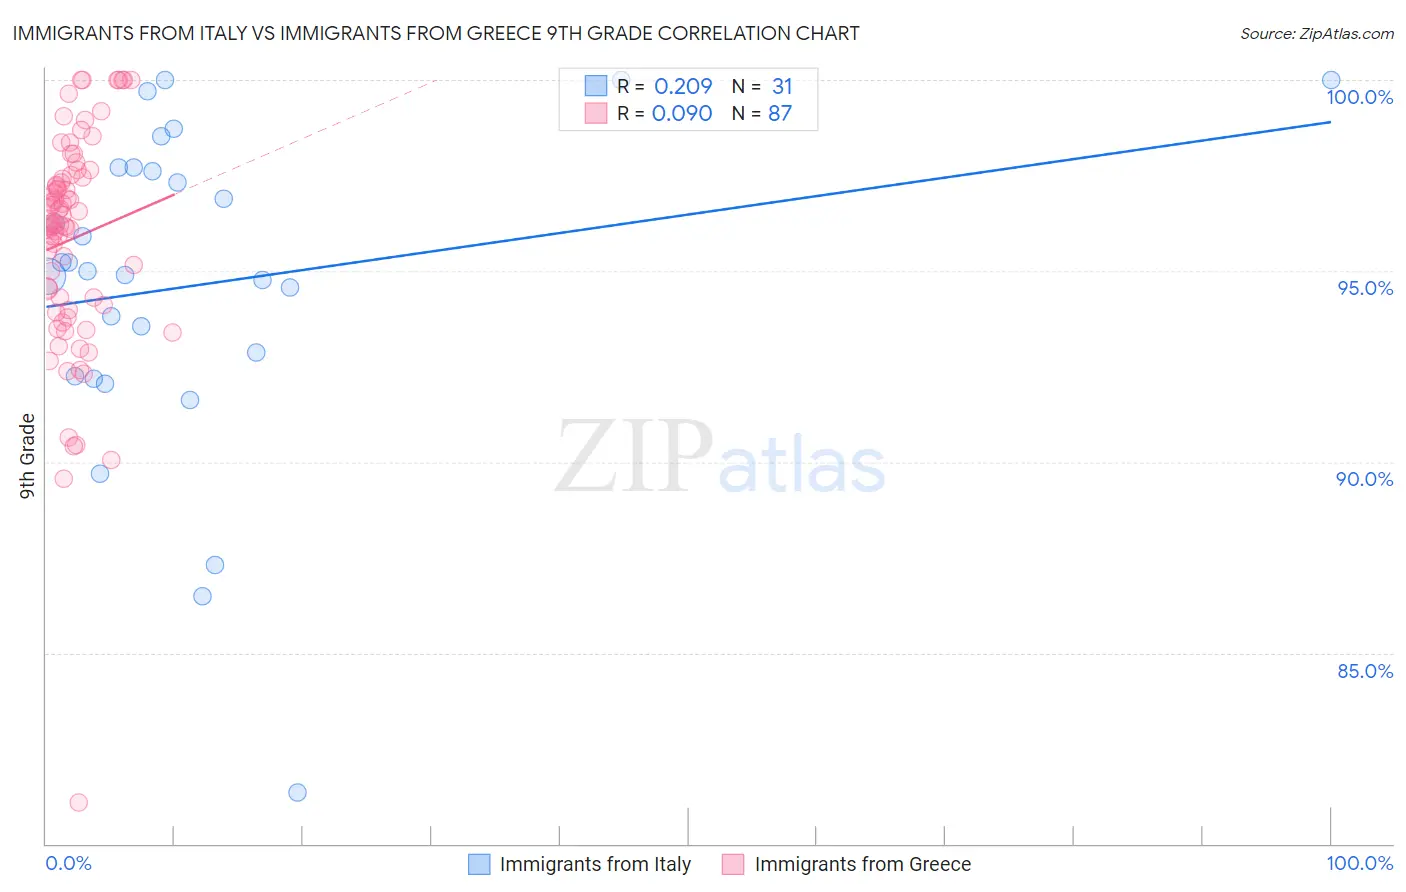
Immigrants from Italy vs Immigrants from Greece 9th Grade Correlation Chart
The statistical analysis conducted on geographies consisting of 324,225,686 people shows a weak positive correlation between the proportion of Immigrants from Italy and percentage of population with at least 9th grade education in the United States with a correlation coefficient (R) of 0.209 and weighted average of 95.0%. Similarly, the statistical analysis conducted on geographies consisting of 216,879,847 people shows a slight positive correlation between the proportion of Immigrants from Greece and percentage of population with at least 9th grade education in the United States with a correlation coefficient (R) of 0.090 and weighted average of 95.2%, a difference of 0.19%.
9th Grade Correlation Summary
| Measurement | Immigrants from Italy | Immigrants from Greece |
| Minimum | 81.3% | 81.1% |
| Maximum | 100.0% | 100.0% |
| Range | 18.7% | 18.9% |
| Mean | 94.6% | 95.8% |
| Median | 95.0% | 96.2% |
| Interquartile 25% (IQ1) | 92.3% | 94.1% |
| Interquartile 75% (IQ3) | 97.7% | 97.4% |
| Interquartile Range (IQR) | 5.5% | 3.3% |
| Standard Deviation (Sample) | 4.3% | 2.9% |
| Standard Deviation (Population) | 4.2% | 2.9% |
Demographics Similar to Immigrants from Italy and Immigrants from Greece by 9th Grade
In terms of 9th grade, the demographic groups most similar to Immigrants from Italy are French American Indian (95.0%, a difference of 0.0%), Immigrants from Ukraine (95.0%, a difference of 0.010%), Egyptian (95.0%, a difference of 0.030%), Immigrants from Kenya (95.0%, a difference of 0.060%), and Mongolian (95.0%, a difference of 0.060%). Similarly, the demographic groups most similar to Immigrants from Greece are Spanish (95.2%, a difference of 0.0%), Immigrants from Bosnia and Herzegovina (95.2%, a difference of 0.010%), Yup'ik (95.2%, a difference of 0.020%), Pueblo (95.1%, a difference of 0.030%), and Immigrants from Sri Lanka (95.1%, a difference of 0.030%).
| Demographics | Rating | Rank | 9th Grade |
| Immigrants | Bosnia and Herzegovina | 85.2 /100 | #141 | Excellent 95.2% |
| Immigrants | Greece | 84.6 /100 | #142 | Excellent 95.2% |
| Spanish | 84.4 /100 | #143 | Excellent 95.2% |
| Yup'ik | 83.3 /100 | #144 | Excellent 95.2% |
| Pueblo | 82.2 /100 | #145 | Excellent 95.1% |
| Immigrants | Sri Lanka | 82.1 /100 | #146 | Excellent 95.1% |
| Choctaw | 81.9 /100 | #147 | Excellent 95.1% |
| Immigrants | Jordan | 81.2 /100 | #148 | Excellent 95.1% |
| Immigrants | Korea | 79.6 /100 | #149 | Good 95.1% |
| Kenyans | 79.1 /100 | #150 | Good 95.1% |
| Cajuns | 77.3 /100 | #151 | Good 95.1% |
| Ugandans | 77.0 /100 | #152 | Good 95.1% |
| Albanians | 76.1 /100 | #153 | Good 95.1% |
| Arabs | 74.9 /100 | #154 | Good 95.1% |
| Immigrants | Kazakhstan | 74.7 /100 | #155 | Good 95.1% |
| Immigrants | Kenya | 73.1 /100 | #156 | Good 95.0% |
| Mongolians | 73.0 /100 | #157 | Good 95.0% |
| Egyptians | 70.1 /100 | #158 | Good 95.0% |
| Immigrants | Ukraine | 67.4 /100 | #159 | Good 95.0% |
| Immigrants | Italy | 66.6 /100 | #160 | Good 95.0% |
| French American Indians | 66.5 /100 | #161 | Good 95.0% |