Welsh vs Colville College, Under 1 year
COMPARE
Welsh
Colville
College, Under 1 year
College, Under 1 year Comparison
Welsh
Colville
66.0%
COLLEGE, UNDER 1 YEAR
69.9/ 100
METRIC RATING
156th/ 347
METRIC RANK
62.1%
COLLEGE, UNDER 1 YEAR
1.0/ 100
METRIC RATING
244th/ 347
METRIC RANK
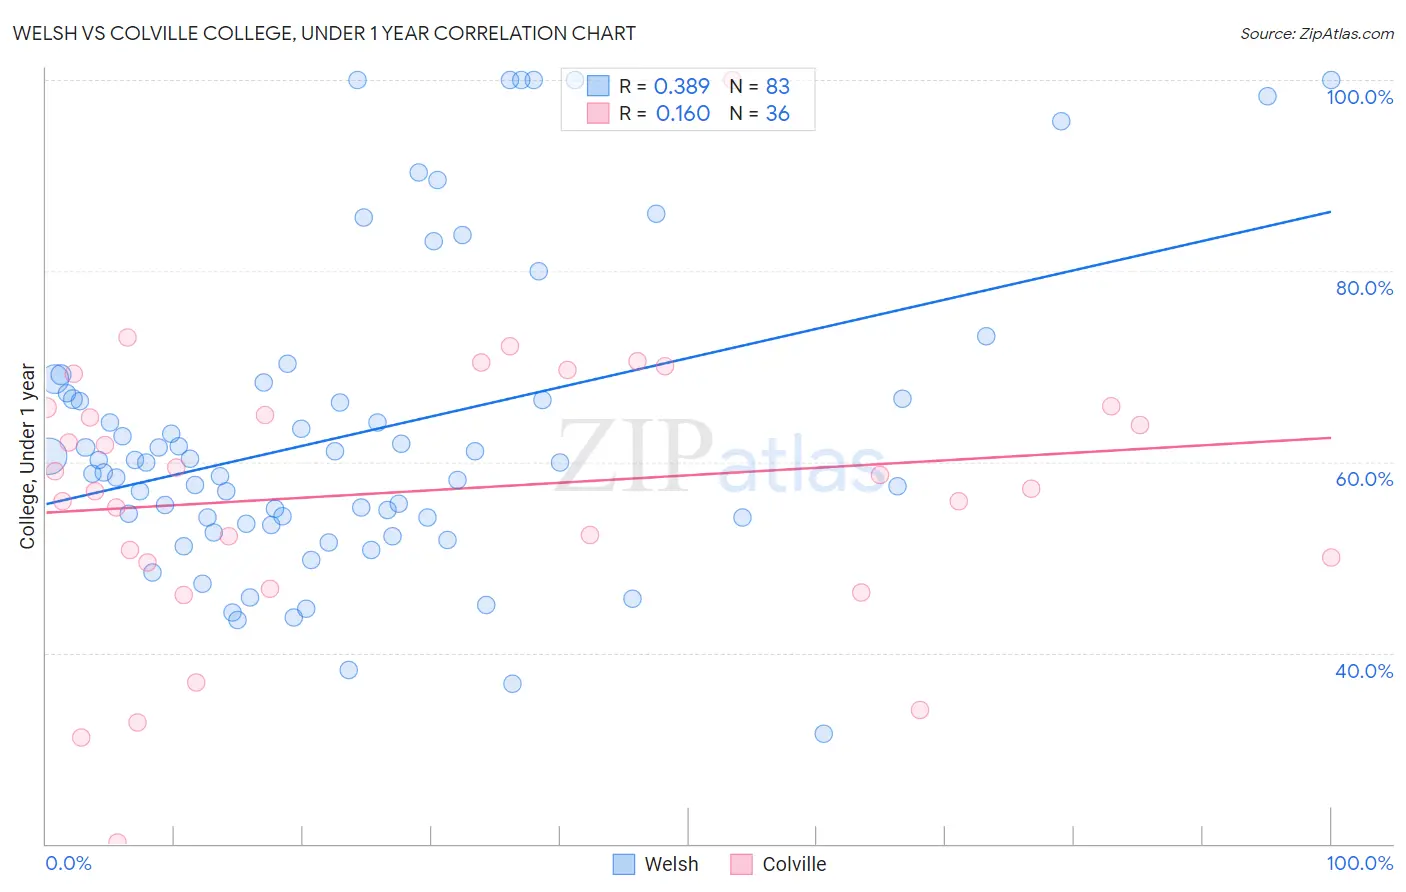
Welsh vs Colville College, Under 1 year Correlation Chart
The statistical analysis conducted on geographies consisting of 528,593,935 people shows a mild positive correlation between the proportion of Welsh and percentage of population with at least college, under 1 year education in the United States with a correlation coefficient (R) of 0.389 and weighted average of 66.0%. Similarly, the statistical analysis conducted on geographies consisting of 34,687,961 people shows a poor positive correlation between the proportion of Colville and percentage of population with at least college, under 1 year education in the United States with a correlation coefficient (R) of 0.160 and weighted average of 62.1%, a difference of 6.3%.
College, Under 1 year Correlation Summary
| Measurement | Welsh | Colville |
| Minimum | 31.6% | 20.2% |
| Maximum | 100.0% | 100.0% |
| Range | 68.4% | 79.8% |
| Mean | 63.1% | 57.0% |
| Median | 60.0% | 57.9% |
| Interquartile 25% (IQ1) | 53.5% | 49.8% |
| Interquartile 75% (IQ3) | 67.2% | 65.7% |
| Interquartile Range (IQR) | 13.7% | 16.0% |
| Standard Deviation (Sample) | 16.3% | 14.8% |
| Standard Deviation (Population) | 16.2% | 14.6% |
Similar Demographics by College, Under 1 year
Demographics Similar to Welsh by College, Under 1 year
In terms of college, under 1 year, the demographic groups most similar to Welsh are Irish (66.0%, a difference of 0.020%), Sierra Leonean (66.0%, a difference of 0.10%), Immigrants from Eritrea (66.1%, a difference of 0.11%), Celtic (65.9%, a difference of 0.13%), and Tlingit-Haida (65.9%, a difference of 0.18%).
| Demographics | Rating | Rank | College, Under 1 year |
| Immigrants | Venezuela | 77.9 /100 | #149 | Good 66.3% |
| Immigrants | Iraq | 77.1 /100 | #150 | Good 66.3% |
| Immigrants | Sudan | 76.0 /100 | #151 | Good 66.2% |
| Sudanese | 74.1 /100 | #152 | Good 66.2% |
| Belgians | 73.7 /100 | #153 | Good 66.2% |
| Immigrants | Eritrea | 71.9 /100 | #154 | Good 66.1% |
| Irish | 70.3 /100 | #155 | Good 66.0% |
| Welsh | 69.9 /100 | #156 | Good 66.0% |
| Sierra Leoneans | 67.8 /100 | #157 | Good 66.0% |
| Celtics | 67.3 /100 | #158 | Good 65.9% |
| Tlingit-Haida | 66.4 /100 | #159 | Good 65.9% |
| Albanians | 66.1 /100 | #160 | Good 65.9% |
| Brazilians | 66.0 /100 | #161 | Good 65.9% |
| Koreans | 65.3 /100 | #162 | Good 65.9% |
| Somalis | 62.7 /100 | #163 | Good 65.8% |
Demographics Similar to Colville by College, Under 1 year
In terms of college, under 1 year, the demographic groups most similar to Colville are Delaware (62.1%, a difference of 0.060%), Hawaiian (62.1%, a difference of 0.090%), Malaysian (62.2%, a difference of 0.12%), Ottawa (62.2%, a difference of 0.17%), and Nepalese (62.2%, a difference of 0.18%).
| Demographics | Rating | Rank | College, Under 1 year |
| Immigrants | Burma/Myanmar | 1.6 /100 | #237 | Tragic 62.5% |
| French American Indians | 1.5 /100 | #238 | Tragic 62.4% |
| Nepalese | 1.1 /100 | #239 | Tragic 62.2% |
| Aleuts | 1.1 /100 | #240 | Tragic 62.2% |
| Ottawa | 1.1 /100 | #241 | Tragic 62.2% |
| Malaysians | 1.1 /100 | #242 | Tragic 62.2% |
| Hawaiians | 1.1 /100 | #243 | Tragic 62.1% |
| Colville | 1.0 /100 | #244 | Tragic 62.1% |
| Delaware | 0.9 /100 | #245 | Tragic 62.1% |
| Marshallese | 0.8 /100 | #246 | Tragic 61.9% |
| Immigrants | Liberia | 0.8 /100 | #247 | Tragic 61.9% |
| Potawatomi | 0.6 /100 | #248 | Tragic 61.8% |
| Vietnamese | 0.5 /100 | #249 | Tragic 61.7% |
| Immigrants | Congo | 0.5 /100 | #250 | Tragic 61.7% |
| Immigrants | Micronesia | 0.5 /100 | #251 | Tragic 61.5% |