Immigrants from Czechoslovakia vs Colville College, Under 1 year
COMPARE
Immigrants from Czechoslovakia
Colville
College, Under 1 year
College, Under 1 year Comparison
Immigrants from Czechoslovakia
Colville
69.6%
COLLEGE, UNDER 1 YEAR
99.7/ 100
METRIC RATING
54th/ 347
METRIC RANK
62.1%
COLLEGE, UNDER 1 YEAR
1.0/ 100
METRIC RATING
244th/ 347
METRIC RANK
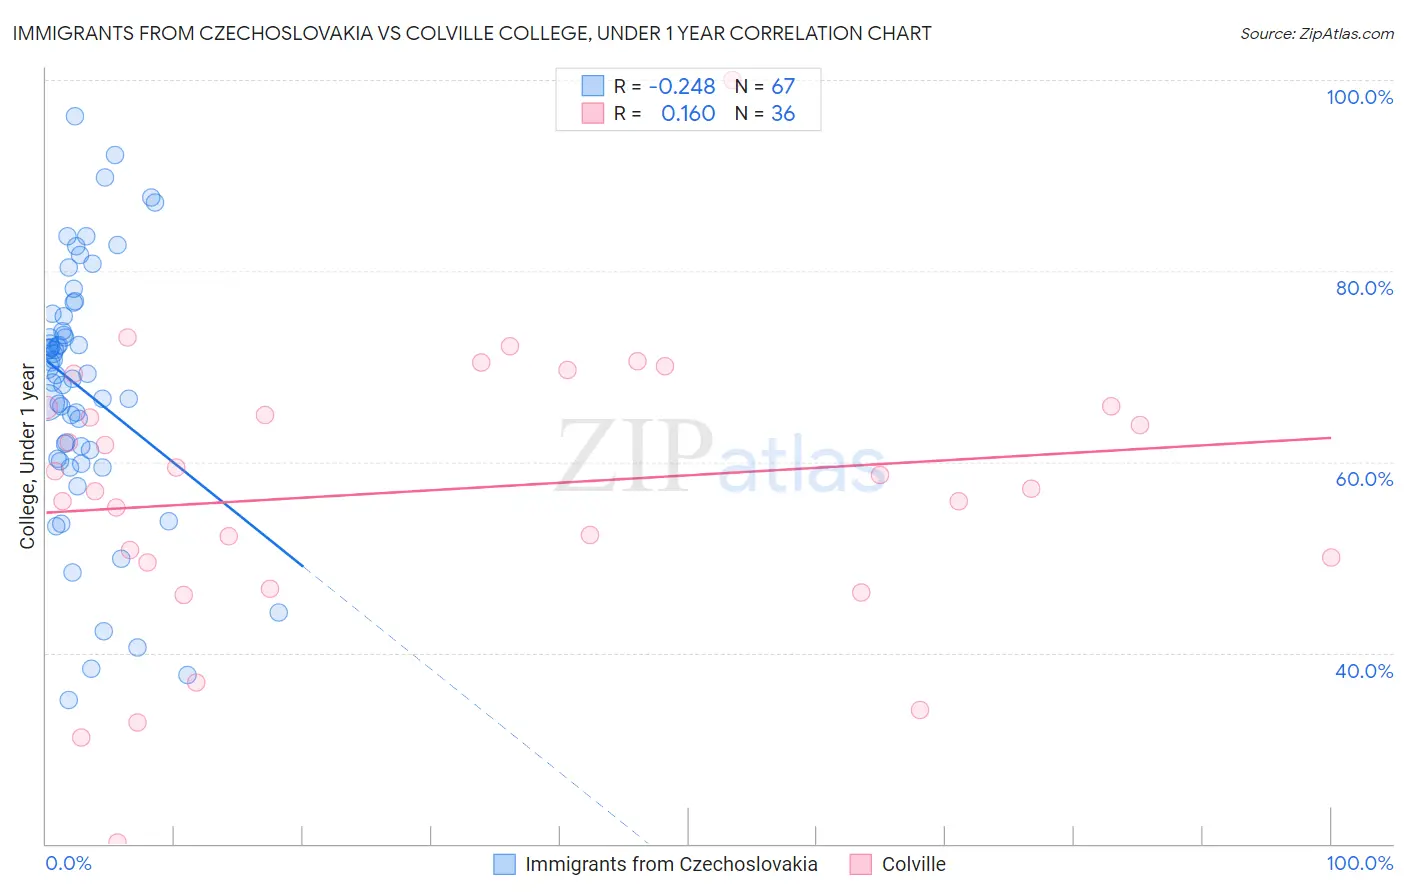
Immigrants from Czechoslovakia vs Colville College, Under 1 year Correlation Chart
The statistical analysis conducted on geographies consisting of 195,448,477 people shows a weak negative correlation between the proportion of Immigrants from Czechoslovakia and percentage of population with at least college, under 1 year education in the United States with a correlation coefficient (R) of -0.248 and weighted average of 69.6%. Similarly, the statistical analysis conducted on geographies consisting of 34,687,961 people shows a poor positive correlation between the proportion of Colville and percentage of population with at least college, under 1 year education in the United States with a correlation coefficient (R) of 0.160 and weighted average of 62.1%, a difference of 12.1%.
College, Under 1 year Correlation Summary
| Measurement | Immigrants from Czechoslovakia | Colville |
| Minimum | 35.1% | 20.2% |
| Maximum | 96.2% | 100.0% |
| Range | 61.1% | 79.8% |
| Mean | 67.6% | 57.0% |
| Median | 69.2% | 57.9% |
| Interquartile 25% (IQ1) | 60.4% | 49.8% |
| Interquartile 75% (IQ3) | 75.3% | 65.7% |
| Interquartile Range (IQR) | 14.9% | 16.0% |
| Standard Deviation (Sample) | 13.2% | 14.8% |
| Standard Deviation (Population) | 13.1% | 14.6% |
Similar Demographics by College, Under 1 year
Demographics Similar to Immigrants from Czechoslovakia by College, Under 1 year
In terms of college, under 1 year, the demographic groups most similar to Immigrants from Czechoslovakia are Maltese (69.5%, a difference of 0.10%), South African (69.7%, a difference of 0.12%), Immigrants from Scotland (69.4%, a difference of 0.22%), Asian (69.4%, a difference of 0.25%), and Immigrants from Malaysia (69.3%, a difference of 0.34%).
| Demographics | Rating | Rank | College, Under 1 year |
| Immigrants | Bulgaria | 99.8 /100 | #47 | Exceptional 70.0% |
| Immigrants | Netherlands | 99.8 /100 | #48 | Exceptional 70.0% |
| Immigrants | Austria | 99.8 /100 | #49 | Exceptional 70.0% |
| Zimbabweans | 99.8 /100 | #50 | Exceptional 69.9% |
| Mongolians | 99.8 /100 | #51 | Exceptional 69.9% |
| Immigrants | Russia | 99.8 /100 | #52 | Exceptional 69.9% |
| South Africans | 99.7 /100 | #53 | Exceptional 69.7% |
| Immigrants | Czechoslovakia | 99.7 /100 | #54 | Exceptional 69.6% |
| Maltese | 99.7 /100 | #55 | Exceptional 69.5% |
| Immigrants | Scotland | 99.6 /100 | #56 | Exceptional 69.4% |
| Asians | 99.6 /100 | #57 | Exceptional 69.4% |
| Immigrants | Malaysia | 99.6 /100 | #58 | Exceptional 69.3% |
| Immigrants | Serbia | 99.5 /100 | #59 | Exceptional 69.3% |
| Immigrants | Asia | 99.5 /100 | #60 | Exceptional 69.2% |
| Immigrants | Kazakhstan | 99.5 /100 | #61 | Exceptional 69.2% |
Demographics Similar to Colville by College, Under 1 year
In terms of college, under 1 year, the demographic groups most similar to Colville are Delaware (62.1%, a difference of 0.060%), Hawaiian (62.1%, a difference of 0.090%), Malaysian (62.2%, a difference of 0.12%), Ottawa (62.2%, a difference of 0.17%), and Nepalese (62.2%, a difference of 0.18%).
| Demographics | Rating | Rank | College, Under 1 year |
| Immigrants | Burma/Myanmar | 1.6 /100 | #237 | Tragic 62.5% |
| French American Indians | 1.5 /100 | #238 | Tragic 62.4% |
| Nepalese | 1.1 /100 | #239 | Tragic 62.2% |
| Aleuts | 1.1 /100 | #240 | Tragic 62.2% |
| Ottawa | 1.1 /100 | #241 | Tragic 62.2% |
| Malaysians | 1.1 /100 | #242 | Tragic 62.2% |
| Hawaiians | 1.1 /100 | #243 | Tragic 62.1% |
| Colville | 1.0 /100 | #244 | Tragic 62.1% |
| Delaware | 0.9 /100 | #245 | Tragic 62.1% |
| Marshallese | 0.8 /100 | #246 | Tragic 61.9% |
| Immigrants | Liberia | 0.8 /100 | #247 | Tragic 61.9% |
| Potawatomi | 0.6 /100 | #248 | Tragic 61.8% |
| Vietnamese | 0.5 /100 | #249 | Tragic 61.7% |
| Immigrants | Congo | 0.5 /100 | #250 | Tragic 61.7% |
| Immigrants | Micronesia | 0.5 /100 | #251 | Tragic 61.5% |