Welsh vs Celtic College, Under 1 year
COMPARE
Welsh
Celtic
College, Under 1 year
College, Under 1 year Comparison
Welsh
Celtics
66.0%
COLLEGE, UNDER 1 YEAR
69.9/ 100
METRIC RATING
156th/ 347
METRIC RANK
65.9%
COLLEGE, UNDER 1 YEAR
67.3/ 100
METRIC RATING
158th/ 347
METRIC RANK
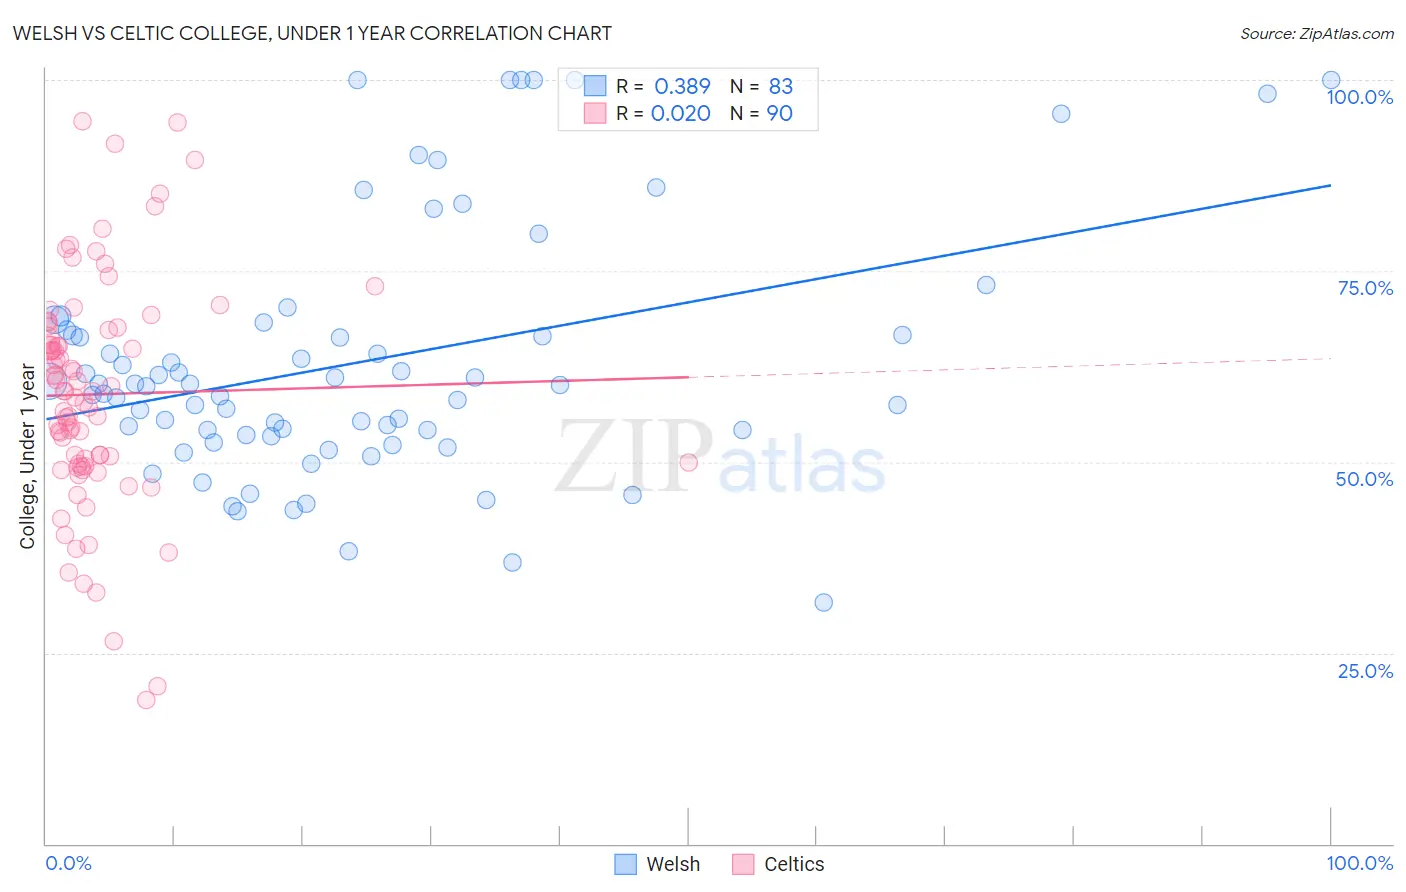
Welsh vs Celtic College, Under 1 year Correlation Chart
The statistical analysis conducted on geographies consisting of 528,593,935 people shows a mild positive correlation between the proportion of Welsh and percentage of population with at least college, under 1 year education in the United States with a correlation coefficient (R) of 0.389 and weighted average of 66.0%. Similarly, the statistical analysis conducted on geographies consisting of 168,877,347 people shows no correlation between the proportion of Celtics and percentage of population with at least college, under 1 year education in the United States with a correlation coefficient (R) of 0.020 and weighted average of 65.9%, a difference of 0.13%.
College, Under 1 year Correlation Summary
| Measurement | Welsh | Celtic |
| Minimum | 31.6% | 18.7% |
| Maximum | 100.0% | 94.6% |
| Range | 68.4% | 75.9% |
| Mean | 63.1% | 58.8% |
| Median | 60.0% | 59.3% |
| Interquartile 25% (IQ1) | 53.5% | 49.8% |
| Interquartile 75% (IQ3) | 67.2% | 67.2% |
| Interquartile Range (IQR) | 13.7% | 17.4% |
| Standard Deviation (Sample) | 16.3% | 14.9% |
| Standard Deviation (Population) | 16.2% | 14.8% |
Demographics Similar to Welsh and Celtics by College, Under 1 year
In terms of college, under 1 year, the demographic groups most similar to Welsh are Irish (66.0%, a difference of 0.020%), Sierra Leonean (66.0%, a difference of 0.10%), Immigrants from Eritrea (66.1%, a difference of 0.11%), Tlingit-Haida (65.9%, a difference of 0.18%), and Albanian (65.9%, a difference of 0.19%). Similarly, the demographic groups most similar to Celtics are Sierra Leonean (66.0%, a difference of 0.030%), Tlingit-Haida (65.9%, a difference of 0.050%), Albanian (65.9%, a difference of 0.060%), Brazilian (65.9%, a difference of 0.070%), and Korean (65.9%, a difference of 0.10%).
| Demographics | Rating | Rank | College, Under 1 year |
| Immigrants | Morocco | 81.7 /100 | #147 | Excellent 66.5% |
| Taiwanese | 78.6 /100 | #148 | Good 66.4% |
| Immigrants | Venezuela | 77.9 /100 | #149 | Good 66.3% |
| Immigrants | Iraq | 77.1 /100 | #150 | Good 66.3% |
| Immigrants | Sudan | 76.0 /100 | #151 | Good 66.2% |
| Sudanese | 74.1 /100 | #152 | Good 66.2% |
| Belgians | 73.7 /100 | #153 | Good 66.2% |
| Immigrants | Eritrea | 71.9 /100 | #154 | Good 66.1% |
| Irish | 70.3 /100 | #155 | Good 66.0% |
| Welsh | 69.9 /100 | #156 | Good 66.0% |
| Sierra Leoneans | 67.8 /100 | #157 | Good 66.0% |
| Celtics | 67.3 /100 | #158 | Good 65.9% |
| Tlingit-Haida | 66.4 /100 | #159 | Good 65.9% |
| Albanians | 66.1 /100 | #160 | Good 65.9% |
| Brazilians | 66.0 /100 | #161 | Good 65.9% |
| Koreans | 65.3 /100 | #162 | Good 65.9% |
| Somalis | 62.7 /100 | #163 | Good 65.8% |
| Czechoslovakians | 62.6 /100 | #164 | Good 65.8% |
| Immigrants | Uzbekistan | 61.6 /100 | #165 | Good 65.8% |
| Moroccans | 56.7 /100 | #166 | Average 65.6% |
| Immigrants | Somalia | 56.4 /100 | #167 | Average 65.6% |