Welsh vs Immigrants from Senegal College, Under 1 year
COMPARE
Welsh
Immigrants from Senegal
College, Under 1 year
College, Under 1 year Comparison
Welsh
Immigrants from Senegal
66.0%
COLLEGE, UNDER 1 YEAR
69.9/ 100
METRIC RATING
156th/ 347
METRIC RANK
63.3%
COLLEGE, UNDER 1 YEAR
5.0/ 100
METRIC RATING
222nd/ 347
METRIC RANK
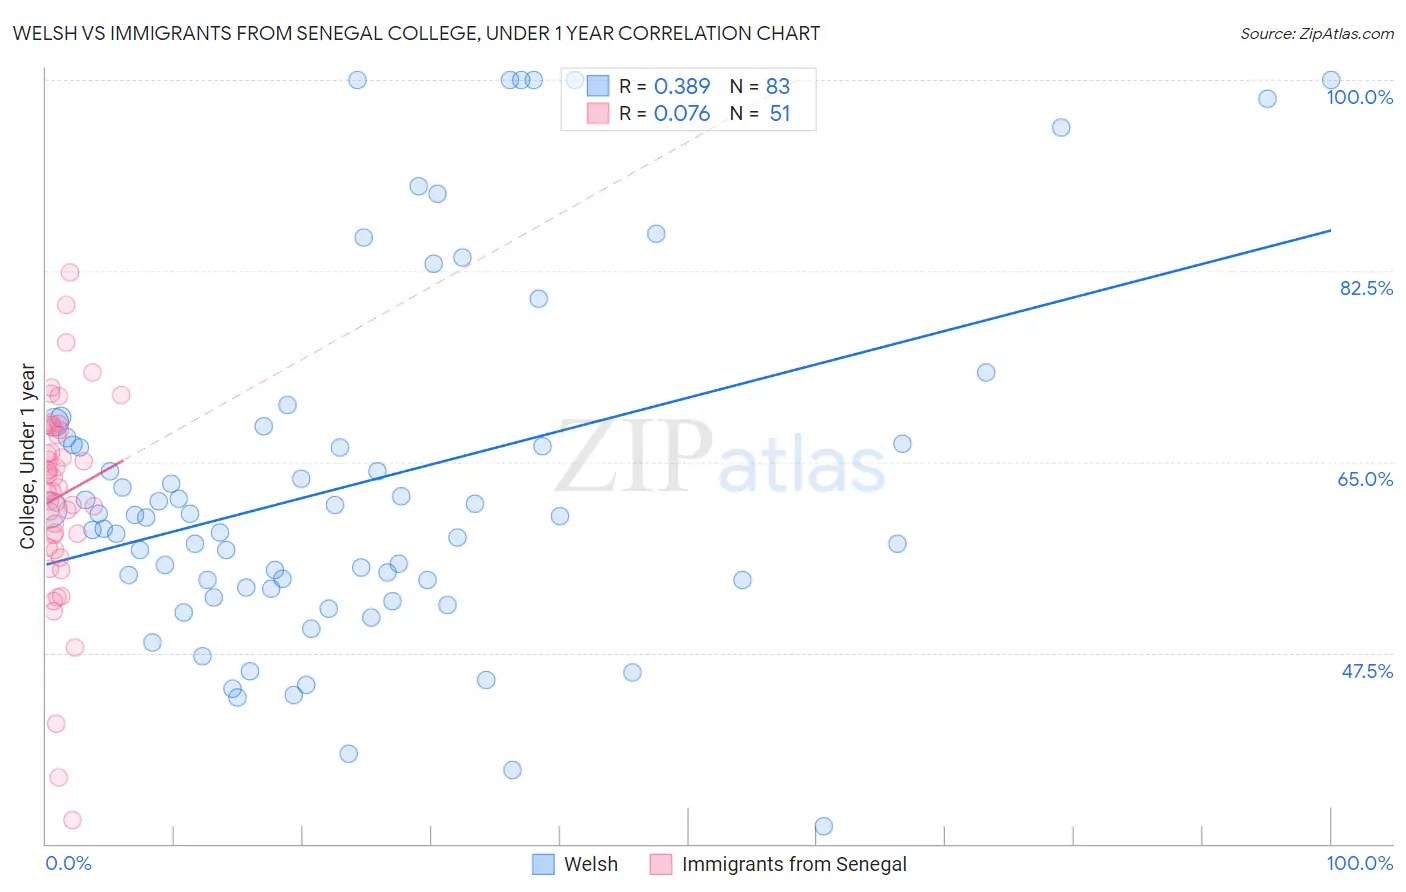
Welsh vs Immigrants from Senegal College, Under 1 year Correlation Chart
The statistical analysis conducted on geographies consisting of 528,593,935 people shows a mild positive correlation between the proportion of Welsh and percentage of population with at least college, under 1 year education in the United States with a correlation coefficient (R) of 0.389 and weighted average of 66.0%. Similarly, the statistical analysis conducted on geographies consisting of 90,129,295 people shows a slight positive correlation between the proportion of Immigrants from Senegal and percentage of population with at least college, under 1 year education in the United States with a correlation coefficient (R) of 0.076 and weighted average of 63.3%, a difference of 4.3%.
College, Under 1 year Correlation Summary
| Measurement | Welsh | Immigrants from Senegal |
| Minimum | 31.6% | 32.1% |
| Maximum | 100.0% | 82.4% |
| Range | 68.4% | 50.2% |
| Mean | 63.1% | 61.9% |
| Median | 60.0% | 62.6% |
| Interquartile 25% (IQ1) | 53.5% | 57.1% |
| Interquartile 75% (IQ3) | 67.2% | 68.1% |
| Interquartile Range (IQR) | 13.7% | 11.0% |
| Standard Deviation (Sample) | 16.3% | 9.5% |
| Standard Deviation (Population) | 16.2% | 9.4% |
Similar Demographics by College, Under 1 year
Demographics Similar to Welsh by College, Under 1 year
In terms of college, under 1 year, the demographic groups most similar to Welsh are Irish (66.0%, a difference of 0.020%), Sierra Leonean (66.0%, a difference of 0.10%), Immigrants from Eritrea (66.1%, a difference of 0.11%), Celtic (65.9%, a difference of 0.13%), and Tlingit-Haida (65.9%, a difference of 0.18%).
| Demographics | Rating | Rank | College, Under 1 year |
| Immigrants | Venezuela | 77.9 /100 | #149 | Good 66.3% |
| Immigrants | Iraq | 77.1 /100 | #150 | Good 66.3% |
| Immigrants | Sudan | 76.0 /100 | #151 | Good 66.2% |
| Sudanese | 74.1 /100 | #152 | Good 66.2% |
| Belgians | 73.7 /100 | #153 | Good 66.2% |
| Immigrants | Eritrea | 71.9 /100 | #154 | Good 66.1% |
| Irish | 70.3 /100 | #155 | Good 66.0% |
| Welsh | 69.9 /100 | #156 | Good 66.0% |
| Sierra Leoneans | 67.8 /100 | #157 | Good 66.0% |
| Celtics | 67.3 /100 | #158 | Good 65.9% |
| Tlingit-Haida | 66.4 /100 | #159 | Good 65.9% |
| Albanians | 66.1 /100 | #160 | Good 65.9% |
| Brazilians | 66.0 /100 | #161 | Good 65.9% |
| Koreans | 65.3 /100 | #162 | Good 65.9% |
| Somalis | 62.7 /100 | #163 | Good 65.8% |
Demographics Similar to Immigrants from Senegal by College, Under 1 year
In terms of college, under 1 year, the demographic groups most similar to Immigrants from Senegal are Cree (63.3%, a difference of 0.050%), Immigrants from Costa Rica (63.2%, a difference of 0.12%), Portuguese (63.4%, a difference of 0.14%), Subsaharan African (63.2%, a difference of 0.15%), and Immigrants from Panama (63.4%, a difference of 0.16%).
| Demographics | Rating | Rank | College, Under 1 year |
| Senegalese | 7.7 /100 | #215 | Tragic 63.6% |
| Hmong | 6.8 /100 | #216 | Tragic 63.5% |
| Immigrants | Uruguay | 5.8 /100 | #217 | Tragic 63.4% |
| Immigrants | Panama | 5.7 /100 | #218 | Tragic 63.4% |
| Immigrants | Fiji | 5.7 /100 | #219 | Tragic 63.4% |
| Portuguese | 5.6 /100 | #220 | Tragic 63.4% |
| Cree | 5.2 /100 | #221 | Tragic 63.3% |
| Immigrants | Senegal | 5.0 /100 | #222 | Tragic 63.3% |
| Immigrants | Costa Rica | 4.5 /100 | #223 | Tragic 63.2% |
| Sub-Saharan Africans | 4.4 /100 | #224 | Tragic 63.2% |
| Immigrants | Peru | 4.0 /100 | #225 | Tragic 63.1% |
| Immigrants | Colombia | 4.0 /100 | #226 | Tragic 63.1% |
| Immigrants | Ghana | 3.7 /100 | #227 | Tragic 63.1% |
| Samoans | 3.3 /100 | #228 | Tragic 63.0% |
| Liberians | 3.2 /100 | #229 | Tragic 63.0% |